
ΑΙhub.org
The lifecycle of “facts”: a survey of social bias in knowledge graphs – interview with Angelie Kraft

In their paper The Lifecycle of “Facts”: A Survey of Social Bias in Knowledge Graphs, Angelie Kraft and Ricardo Usbeck conducted a critical analysis of literature concerning biases at different steps of a knowledge graph lifecycle. Here, Angelie tells us more about knowledge graphs, how social biases become embedded in them, and what researchers can do to mitigate this.
What is the topic of the research in your paper and what problem(s) did you investigate?
We wanted to understand where and how social biases enter knowledge graphs and how they take effect. To achieve this, we conducted a literature survey that considered a knowledge graph’s full lifecycle, from creation to application.
Knowledge graphs can be used to represent factual information in a structured way. Wikidata, for example, is a large-scale graph that structures the type of encyclopedic information you can find on Wikipedia using crowdsourcing.
All information is stored as [head entity, relation, tail entity] triples, like for example [Barack Obama, gender, male] as depicted in the exemplary knowledge graph in figure 1. The natural language processing (NLP) community utilizes them for knowledge-driven downstream tasks such as question answering or conversational agents. In the context of natural language generation, they can be used to enhance the factuality of the generated texts: Since language models are strictly statistical, an output like “Barack Obama’s wife Hillary” is likely and plausible. This can be improved by injecting triples, like [Barack Obama, spouse, Michelle Obama] in this example (which was inspired by the title of the work by Logan et al. [1]).
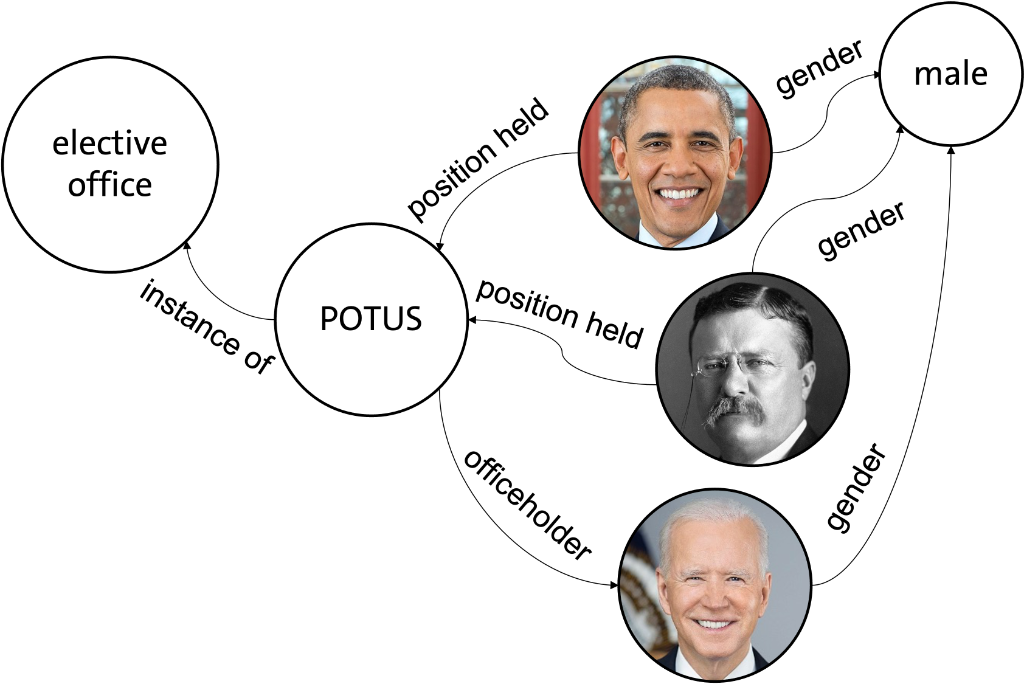 Figure 1
Knowledge graphs are often referred to as a “source of truth”. Moreover, as the example in figure 1 shows, the graph structure is easily interpretable by humans which makes it a transparent technology. Due to these properties, there is a narrative around knowledge graphs as facilitators of reliability and trustworthiness. Our research aims to challenge this narrative by pointing out an important flaw, namely the manifestation of social biases. Knowledge graphs aim to represent the world as it is, which in itself is characterized by societal inequalities. For example, there has never been a female U.S. president and hence cannot be found in an encyclopedic graph. Mostly, however, they are not fully accurate and instead even exaggerate inequalities.
Could you talk a bit about how social biases become engraved in knowledge graphs and what some of the implications are?
Social biases become engraved in knowledge graphs through manual and automated procedures during the creation process. Wikidata and DBpedia, for example, are the products of ongoing crowdsourcing efforts. They illustrate how homogenous author and annotator crowds lead to an underreporting of whole parts of society. Analyses of these graphs repeatedly show that non-male personalities are generally underrepresented [2], as well as the non-industrialized and the non-Western world [3]. This may be attributed to the fact that Wikimedia contributors are predominantly white, Western-European males [see Gender bias on Wikipedia, Racial bias on Wikipedia, and List of Wikipedias].
Another important ingredient for the creation of knowledge graphs are ontologies. These are rules that determine which type of entities and relations can be represented. They are usually designed manually and thus susceptible to a range of human biases. For example, whether or not allowing several spouse relations as opposed to a single one per entity seems logical can depend on cultural and religious beliefs [4].
Lastly, there are a lot of automated knowledge graph creation and population approaches. These employ NLP techniques to gather entities and relations from unstructured text. These algorithms, again, are subject to social bias. Researchers showed that some systems perform differently well for typically white versus non-white appearing given names [5] or female versus male names [6].
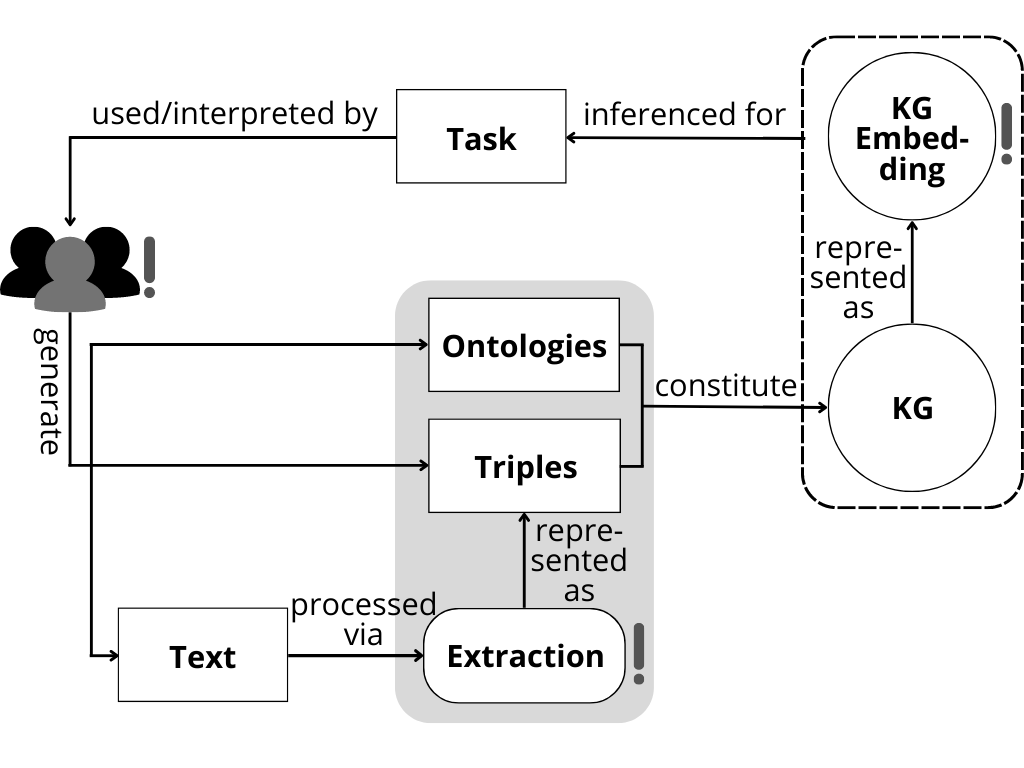 Figure 2
Could you explain your methodology for conducting the survey?
We followed a standard procedure to include all relevant peer-reviewed publications since 2010. For this, we queried a range of literature databases, namely Google Scholar, Science Direct, ACM Digital Library, and Springer. We first searched for all titles including terms like knowledge graph and ontology, as well as variants of bias or fairness. The matches were then filtered for articles that were related to bias in a social as opposed to, for example, a technical sense. This process resulted in a total of 18 articles. This rather low number indicates how little attention this area has received so far. Too little, in our opinion.
What were your main findings?
Even if knowledge graphs correctly represent the world as it is, they are likely to perpetuate historically emerged social inequalities by establishing them as a desirable truth. That being said, we found that popular large-scale graphs are subject to sampling bias and do misrepresent the real world. The identified biases correspond to problematic societal inequalities, such as an underrepresentation of the non-western, non-industrialized world [3], and non-male individuals [2]. Knowledge graphs are popularly used in a vectorized form to facilitate the utilization of overarching connectivity patterns. Some of the evidence indicates that vectorization algorithms can lead to an amplification of the biases [7]. Technologies used to infer from these representations pick up on the biases and propagate them downstream [8].
More research regarding this subject is urgently needed, especially given the rising interest in and use of knowledge graphs (as indicated by the steep upwards trend of publications in the field [9]). Most of the publications we reviewed address biases regarding binary gender as an example of a sensitive attribute. Rarely were ethnicity, religion, or nationality examined. Similarly, all of the works used occupation as the dependent measure. Future work should investigate the representations regarding a broader set of human attributes to understand the engraved biases more exhaustively. Moreover, newly proposed measurement instruments are oftentimes not properly validated. In these cases, it is not ensured that a proposed measure for gender bias indeed measures the concept in a social scientific sense. That goes hand in hand with another limitation we have observed: Most authors do not reference established taxonomies of bias and harm or give clear working definitions. Given the limited expressiveness of the bias measures, the effectiveness of mitigation interventions is consequently hard to judge.
Do you have any recommendations for researchers who are creating knowledge graphs?
Researchers concerned with bias in NLP have been promoting several recommendations that are increasingly adopted by the community. In our opinion, they are also applicable to knowledge graphs. First of all, they should be created and maintained in a transparent and accountable manner. Data Sheets [10] or Model Cards [11] are already well-established and should be used also for knowledge graphs and their vectorized versions.
Whenever researchers are planning to create a new knowledge graph, they must go about the issue with intention. We must always expect that harmful biases will find their way into the data if they are not avoided by design. To deal with the underrepresentation of a wide range of social groups, data authors and annotators must come from diverse socio-cultural backgrounds and represent different identities. Furthermore, researchers should have a set of measures in place with which potential biases can be detected continuously. They should think about the domain in which the knowledge graph will be used when selecting these measures. Finally, applying diverse metrics that cover different bias dimensions should facilitate more valid conclusions.
About Angelie
|
|
Angelie Kraft has an interdisciplinary background in Psychology and Computer Science. She is currently a doctoral student at the Semantic Systems group at Universität Hamburg, where she researches natural language processing and knowledge-driven technologies with a focus on bias and fairness aspects. |
References
[1] Logan, R., Liu, N. F., Peters, M. E., Gardner, M., and Singh, S.. 2019. Barack’s Wife Hillary: Using Knowledge Graphs for Fact-Aware Language Modeling. In Proceedings of the 57th Annual Meeting of the Association for Computational Linguistics, pages 5962–5971, Florence, Italy. Association for Computational Linguistics.
[2] Beytía, P., Agarwal, P., Redi, M., and Singh, V. K.. 2022. Visual gender biases in Wikipedia: A systematic evaluation across the ten most spoken languages. In Proceedings of the International AAAI Conference on Web and Social Media, pages 43–54.
[3] Janowicz, K., Yan, B., Regalia, B., Zhu, R., and Mai, G.. 2018. Debiasing knowledge graphs: Why female presidents are not like female popes. In Proceedings of the ISWC 2018 Posters & Demonstrations, Industry and Blue Sky Ideas Tracks co-located with 17th International Semantic Web Conference (ISWC 2018).
[4] Keet, M. C.. 2021. An exploration into cognitive bias in ontologies. In Joint Ontology Workshops 2021 Episode VII: The Bolzano Summer of Knowledge, JOWO 2021.
[5] Mishra, S., He, S., and Belli, L.. 2020. Assessing demographic bias in named entity recognition. In Proceedings of the AKBC 2020 Workshop on Bias in Automatic Knowledge Graph Construction.
[6] Mehrabi, N., Gowda, T., Morstatter, F., Peng, N., and Galstyan, A.. 2020. Man is to person as woman is to location: Measuring gender bias in named entity recognition. In Proceedings of the 31st ACM Conference on Hypertext and Social Media, HT ’20, page 231–232, Online. Association for Computing Machinery.
[7] Radstok, W., Chekol, M. W., and Schäfer, M. T.. 2021. Are knowledge graph embedding models biased, or is it the data that they are trained on? In Proceedings of the 2nd Wikidata Workshop (Wikidata 2021) co-located with the 20th International Semantic Web Conference (ISWC 2021).
[8] Arduini, M., Noci, L., Pirovano, F., Zhang, C., Shrestha, Y. R., and Paudel, B.. 2020. Adversarial learning for debiasing knowledge graph embeddings. In Proceedings of the 16th International Workshop on Mining and Learning with Graphs (MLG).
[9] Schneider, P., Schopf, T., Vladika, J., Galkin, M., Simperl, E., and Matthes, F. (2022). A Decade of Knowledge Graphs in Natural Language Processing: A Survey. arXiv preprint arXiv:2210.00105.
[10] Gebru, T., Morgenstern, J., Vecchione, B., Vaughan, J. W., Wallach, H., Daumé, H. III., and Crawford, K. (2021). Datasheets for datasets. Communications of the ACM, 64(12), 86-92.
[11] Mitchell, M., Wu, S., Zaldivar, A., Barnes, P., Vasserman, L., Hutchinson, B., Spitzer, E., Raji, I. D., and Gebru, T. (2019). Model cards for model reporting. In Proceedings of the Conference on Fairness, Accountability, and Transparency, FAT* ’19, page 220–229, Atlanta, GA, USA. Association for Computing Machinery.

AUAI is supported by: