ΑΙhub.org
Interview with Ernest Mwebaze: a machine learning-based app for diagnosing plant diseases
Ernest Mwebaze and his team have developed a mobile application for farmers to help diagnose diseases in their cassava crops. We spoke to Ernest to find out more about this project, how it developed, and plans for further work.
Could you start by giving us a general overview of the project and the problem that you were trying to solve?
The work really targets improving the livelihoods of smallholder farmers in Sub-Saharan Africa. The society in Sub-Saharan Africa is predominantly agricultural, with the livelihoods of over 70% of people depending on agriculture. We targeted the cassava plant, one of the key crops here; it’s second after maize, and it’s one of major sources of carbohydrates for people here in Sub-Saharan Africa. The key problem with cassava for farmers is that they lose a lot of yield each year due to crop diseases. So, our target was really to contribute to addressing the problem by automating disease diagnostics. The farmers face the problem of not knowing when their crops are diseased. Even when they do know, they know which disease it is that they’re looking at. We tried to automate the expert task of recognizing crop diseases in cassava.
How did you go about developing the project, and what methods did you use to recognize disease in the plants?
In Uganda, where this project is based, there are about 47 languages and dialects, so if you’re trying to build an application for use in the field that can detect diseases and give the farmers information, you want it to be visual.
Ordinarily what happens is that they would call an expert and explain the disease to them: “I see a yellowish thing on my plants”, for example, but this requires that the experts can speak all the languages. So, for this reason, we chose images, and a visual application. With our tool, once you’ve taken an image it gives you a clear picture of what’s happening. Images are really simple: you take an image, you process it through some algorithm, and the algorithm spits out whether the plant is diseased or not, what kind of disease it has, and how severe it is.
The problem with images, of course, is that the diagnosis depends on the symptomatic expression of the disease in the plant, so you have to wait until the disease goes through the plant, and then it appears on the aerial part of the plant, which can be on the stork or on the leaves. So, we wondered how we could get to the disease before it’s expressed symptomatically in the aerial parts of the plant, and spectral data was something that we thought could be an option. Can we pass light through the plant and, based on how the light interacts with the molecules in the leaf, determine the disease? And so, this is what we did. We found that using spectral data you get a diagnosis maybe six weeks earlier than by using images.
How did you collect the spectral data?
We did a random control trial. So, we collected spectra both in the field and also the greenhouse. In a greenhouse, it is possible to carefully calibrate the disease. In the greenhouse, we inoculated the plants and we could see how the disease grew within the plant, we could measure at different points using spectral data to understand where the disease actually was in the plant, and how it manifested visually.
We used what’s called a handheld leaf spectrometer. You clamp it on the leaf and by passing light through the leaf, and measuring the refraction and absorption of light, it can determine the properties of the leaf.
In the field, the method of disease infection is by natural means, for example, there are white flies that spread the disease. The problem there is that you do not know the exact time when the plant was infected.
For both of these (the greenhouse and the field samples) we did what is called wet-lab chemistry, so we took samples of the leaf, took them to the lab, and determined chemically the diseases. We used that information to calibrate our spectrometry.
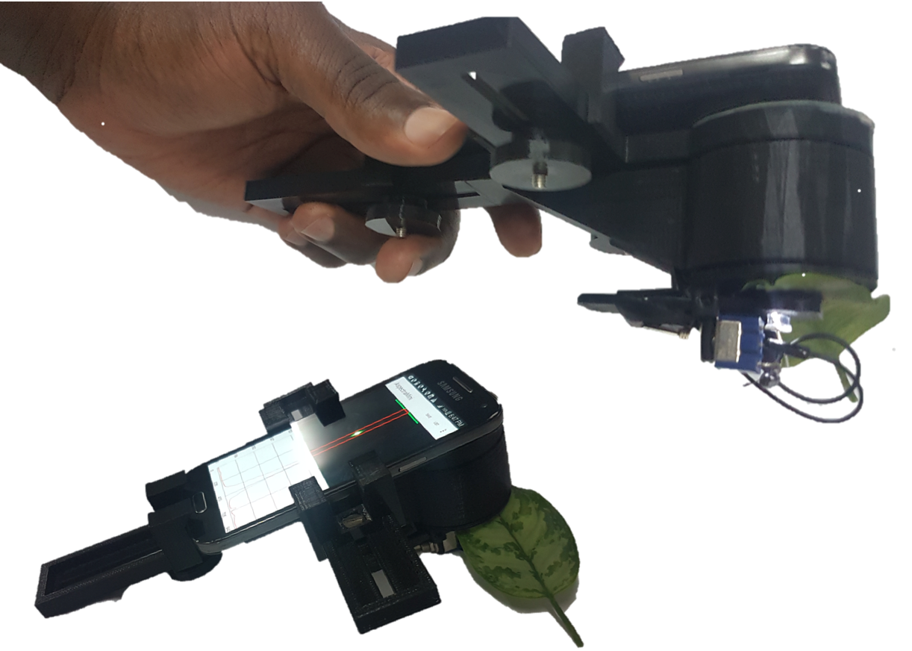 The handheld leaf spectrometer.
What kind of size was the dataset that you collected?
For each plant we had several readings. Each leaf is multi-lobed, and we collected three measurements per leaf, for three leaves per plant, every day for about eight months, so we had a lot of data. In addition, for each plant we collected, we measured it over its lifetime, which is about six months. When the leaves are cut off and measured, new leaves grow, and we measure those too, and so on. We collected from about 20 diseased plants, and about 20 control plants. If you look at the actual quantity of data, then it’s a lot.
Could you tell us about the classification model?
For the classification with the images we used convolutional neural networks. These are a class of deep neural networks that can process image data. We actually tried two different methods. One method, which is kind of an old-school method, was to calculate features from the image. You can take things like color, or the shape of the leaf, things that sometimes get deformed by the disease. These are what we call sift features or sub features. You extract different features from the image of the leaf that represent disease or change in the ordinary state of the leaf. That was the initial method. With the advent of deep neural networks came the advantage that you don’t have to specifically calculate these features, you can just supply the network with these images and the algorithm calculates the features. That was the transition with the images.
For the spectral data, we used a set of algorithms whose family is called learning vector quantization algorithms. What these try to do is extract relevant features from the spectra which are most relevant for the prediction you are doing. These are called distance-based algorithms. By calculating the distance between different expressions of the leaf to what a prototype looks like, you can make an inference as to whether these spectral signatures represent a diseased plant or a healthy plant. The advantage of this method is that it can also tell you which features in the spectral expression are most relevant for predicting disease.
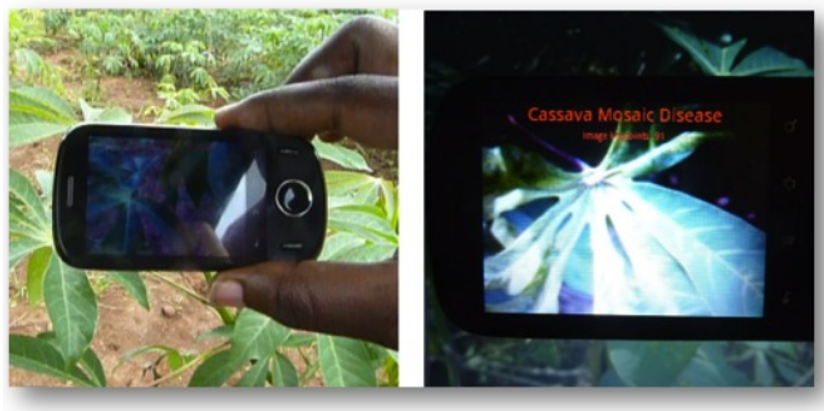 Automating disease diagnosis using smartphones.
So, how far along are you in terms of applying the app in practice?
We have tested the method with farmers, and it was quite revealing. There are about four main diseases in cassava. With our app, you have an algorithm that, once you point the phone at a plant, gives you a classification – either one class from these four diseases, or it tells you the plant is healthy. Chatting to some farmers, we found out that one of the things they did was to point it at strange things. For example, one farmer pointed it at his wife, and the app came up with a reading, that his wife had cassava mosaic disease! And he said “well, this thing doesn’t really work”. We quickly realized that on top of training the farmers how to use it, we need to make it robust. By robustness I mean, if they point it at a bean plant, or at a person, or at the sky, the algorithm should be able to say, “OK this is non-determined”. We had to rebuild the app to fix this. The other lesson we learned was that just providing the app alone is not sufficient, the farmers need many other things. Once they have understood the disease, they need to understand how they can get help, they want to get advice from the experts, they want to communicate amongst themselves, they want to get news of new diseases, and so on. So, bundling the diagnostic app with other features was one of the things we did.
What’s the latest status of the project?
The team I work with has grown. Right now, the team are involved in things like advisory roles, so they give the farmers more advice on top of the app; advice about the diseases, when it’s best to plant, insecticides to use, things like that. For the machine learning community what we did was build a huge dataset of cassava images and from that we built the base models that form the foundation of models for disease detection. We’ve published these and we’ve published the dataset. This helps other people who want to build similar applications which diagnose diseases in other plants. They can quickly build off the success of what we did. There have been about 400 downloads of this base model, so it has been quite impactful for the community.
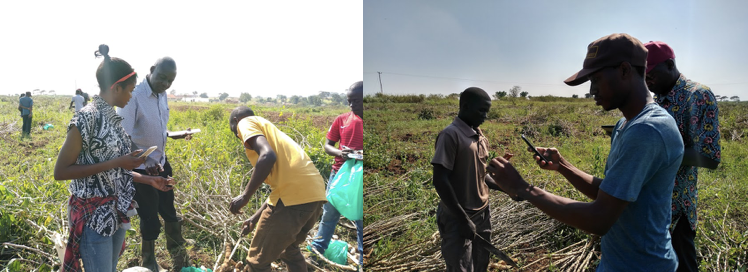 Testing the app in the field.
Are there any planned further improvements relating to this project?
One thing we are looking at is focusing on disease diagnosis at the macro level. So, the app we built was really for the individual farmer. What we saw was once you get many farmers uploading their data, you get a sense of what the state of disease is in a certain area. We want to augment that data with satellite data to determine disease density across different regions, for example. This could augment government policy, with interventions being taken in areas where a particular disease is prevalent, for example. We’re also interested in scaling the work to other diseases.
Read more about this research in this published article: Matrix Relevance Learning From Spectral Data for Diagnosing Cassava Diseases, Godliver Owomugisha, Friedrich Melchert, Ernest Mwebaze, John. A. Quinn, Michael Biehl.
About Ernest
|
Ernest Mwebaze obtained his doctorate in machine learning from the University of Groningen. He has over 10 years experience in academia where he was part of the faculty at the School of Computing and Informatics Technology of Makerere University in Uganda. At Makerere University he co-led the Makerere Artificial Intelligence research lab and headed several research projects. He has worked with the UN at the Pulse Lab Kampala and with Google AI, in Accra, Ghana. His current portfolio includes being the Executive Director at Sunbird AI, a non-profit focused on building practical AI systems for social good. |
|
The AI Around the World series is supported through a donation from the Mohamed bin Zayed University of Artificial Intelligence (MBZUAI). AIhub retains editorial freedom in selecting and preparing the content. |
tags: AI around the world
AUAI is supported by: