ΑΙhub.org
Interview with Ananya Joshi: Real-time monitoring for healthcare data
In this interview series, we’re meeting some of the AAAI/SIGAI Doctoral Consortium participants to find out more about their research. Ananya Joshi recently completed her PhD, where she developed a system that experts have used for the past two years to identify respiratory outbreaks (like COVID-19) in large-scale healthcare streams across the United States using her novel algorithms for ranking real-time events from large-scale time series data. In this interview, she tells us more about this project, how healthcare applications inspire basic AI research, and her future plans.
Could you start by telling a bit about PhD? What was the topic of your research?
When I started my PhD during the COVID-19 pandemic, there was an explosion in continuously-updated human health data. Still, it was difficult for people to figure out which data was important so that they could make decisions like increasing the number of hospital beds at the start of an outbreak or patching a serious data problem that would impact disease forecasting. What they needed was a system to monitor this real-world big data in real-time so that the most important data could be quickly acted upon.
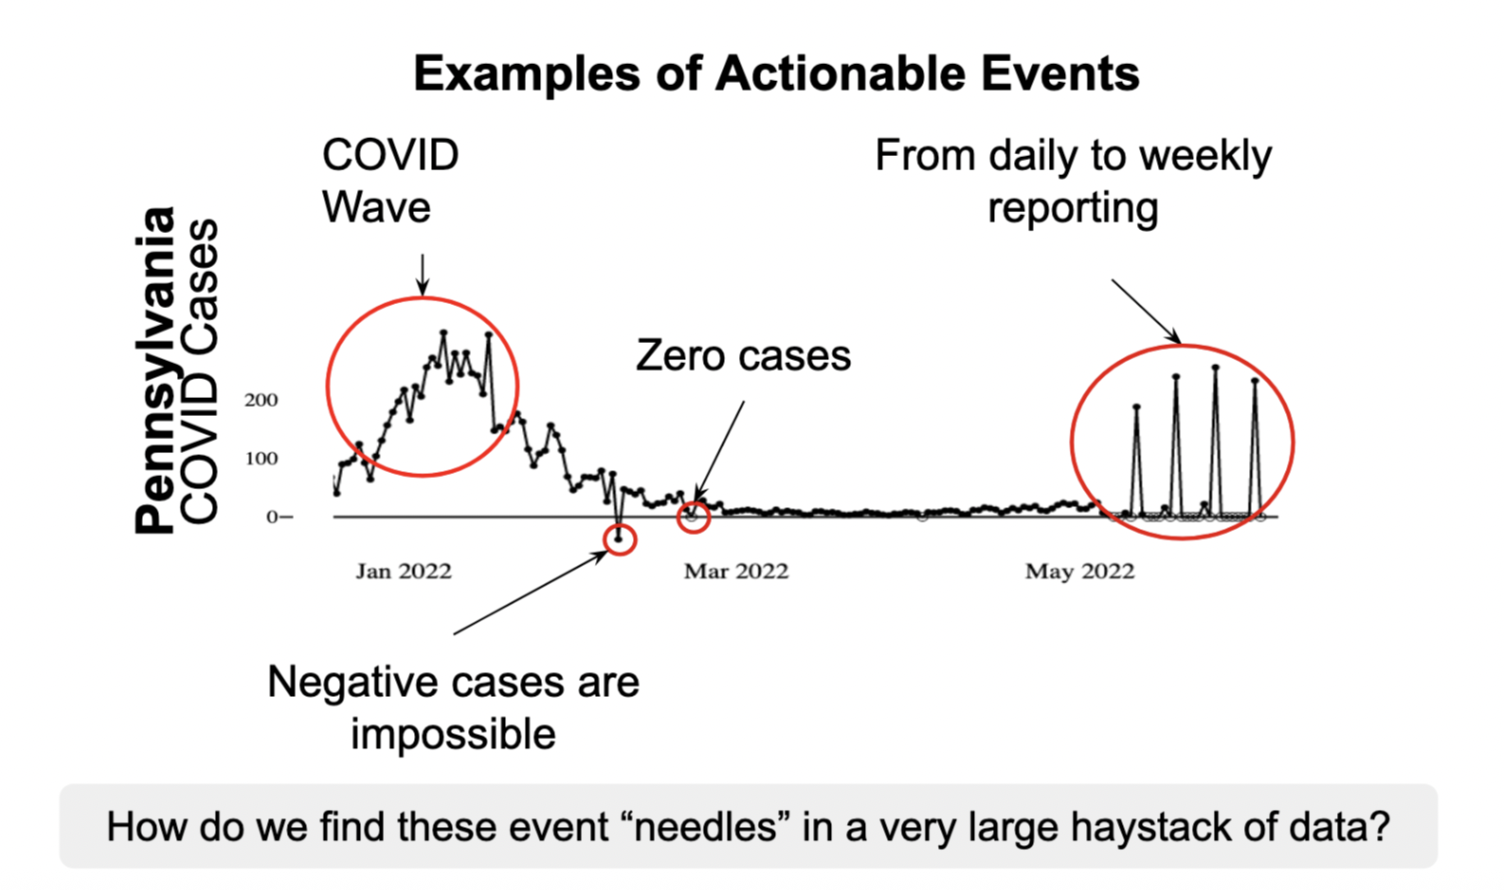
To build this system, I first needed to address a theoretical computational research question. When there is so much data, there are hundreds of thousands of potentially interesting data points. However, human attention is limited, and what is more helpful is to know, “How do you prioritize anomalies in large, continuously updated datasets?” Once you have this ranking of the most unexpected data points, humans can prioritize their attention accordingly — and there are interesting applications of these methods beyond the healthcare domain in technological, agricultural, and economic domains.
This system was deployed over two years ago at Carnegie Mellon in the Delphi Group and has since been used daily to triage public health data in the United States. After adopting this system, human efficiency in events detected/min has increased by over 52 times and hundreds of data segments are identified as events per week versus two to three historically.
You said the historical methods weren’t the best for dealing with public health data and looking for data events. Could you talk about those historical methods, and then the new methodology that you developed during your PhD?
Many domains have recently invested in sensors that produce measurements over time, called data streams. These data streams can be imperfect; public health data streams are noisy, nonstationary, and incomplete. When there is an event (e.g. an outbreak), sensors may report values that deviate from what is expected. Historically, experts could use standard univariate outlier/anomaly detection tools across each of the data streams to surface these anomalies.
While there are many anomaly detection methods, most consist of these four steps:
- Generate a forecast of the data (what do you expect the data to look like?)
- Define a difference (what does it mean to deviate from the data?)
- Contextualize the difference (what does this difference mean in the context of the data?)
- Set an alerting threshold (when is that contextualized difference important enough to set an alert?)
Yet, at current scale, these methods lead to hundreds of thousands of alerts (“What Can You Really Do with 35,000 Statistical Alerts a Week Anyways?”) that also have statistical issues (Statistical challenges facing early outbreak detection in biosurveillance). Building a ranking of anomalies from multiple data streams would match what public health experts needed from the data — and it is also a new machine learning task we identified and called multi-stream outlier ranking.
A practical solution to this problem not only needs to be statistically correct, but also must meet constraints from public health experts — like being lightweight and interpretable. This required reimagining the four anomaly detection steps.
From automated to informed selection (steps 1 and 2)
Most outlier detection methods are variants of only steps 1 and 2 whereas steps 3 and 4 are seen as parameters (e.g. what threshold should alerts be sent at).
This setup is not always intuitive. Domain experts know a) information that’s not available in any data, like a data policy change and b) have restrictions like compute or interpretability requirements. So, using their insights in defining an expectation (step 1) and difference metric (step 2) instead of pulling an off-the-shelf method means we have the base components to find data that is the most different from their expectations — and these components can be changed at any time to match expert guidance.
Contextualizing at scale and ranking (steps 3 and 4)
Although the process of defining expectations and difference is expert-defined, we now need a way to scale and contextualize that information across large volumes of data streams, where the used defined expectations may be different accurate, say for COVID-19 cases streams in a big city like New York City versus a small county like Loving County, Texas.
My algorithms for this task are grounded on a branch of statistics called extreme value theory and adapted for real world settings that violate many formal guarantees on data distributions. First, the output from step 2, called a test-statistic, is normalized over time and across streams. Streams are then grouped together using a hierarchy of similarly collected data (in our case, that is geospatial), and the maximum of each group over historical data is stored.
Then, new, real-time test statistics corresponding to the most recently seen data are ranked based on how much higher they are than historical values. What’s great about this approach is that it also easily generalizes to anomalous sequences and empirically produces few ties.
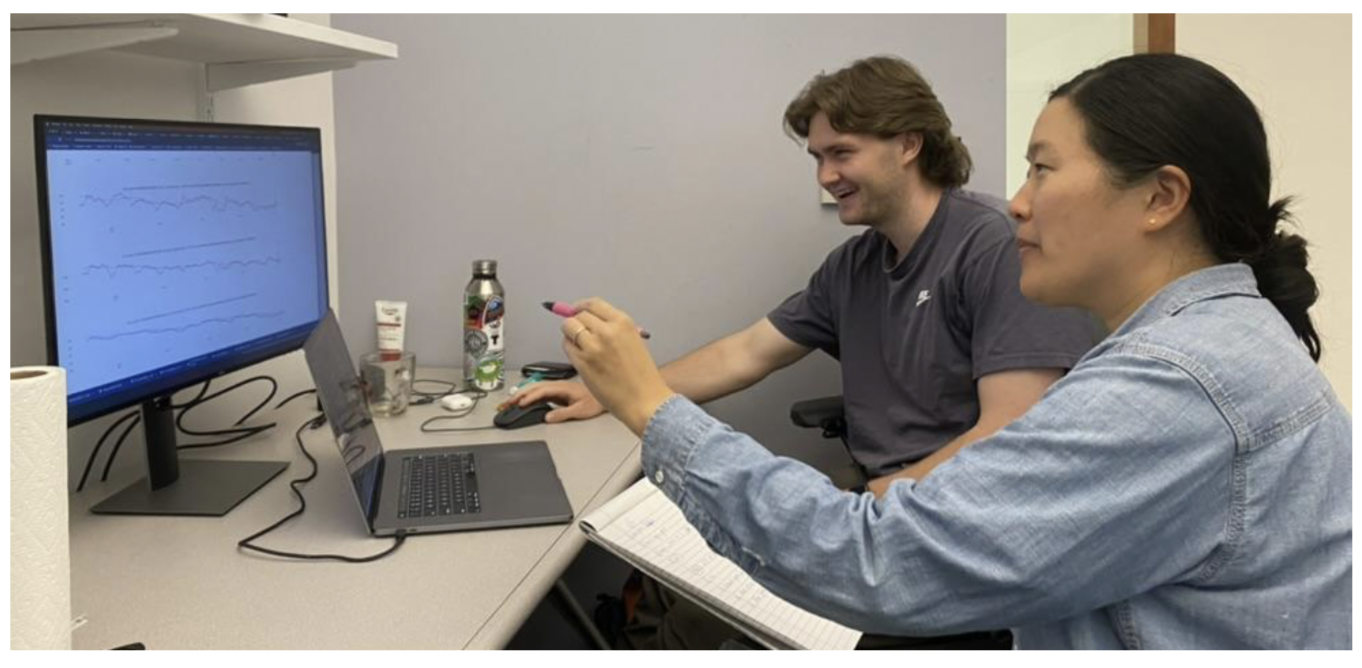
These methods change the way that monitored data is reviewed and evaluated, so I needed to a) design a new system for review with b) new evaluation metrics. This is where it was great to be part of an interdisciplinary team (Nolan Gormley, Richa Gadgil, Catalina Vajiac, Tina Townes, and my advisors Bryan Wilder and Roni Rosenfeld), and I learned a lot about what it takes (research and otherwise) to see a new paradigm through.
Keeping humans in the loop, I assume you worked closely with different domain experts during your PhD?
That’s right. For this system, the most important person is the domain expert data reviewer. They define what is expected from the data so that we can show them patterns that most deviate from their expectations as events. Still, their actions are informed by constraints from methodologists, engineers, and stakeholders like public health experts or members of the public, so we leaned into participatory design and team science to make sure this project was successful.
So how do you input the advice from the epidemiologist (or other domain expert) into the loop? Does the model constantly get updated based on their advice?
Historically, group check-ins take about five to ten minutes per week, and reviewers look at a ranked list daily instead of alerts. During these check-ins, we learn if we need to change steps 1 and 2 from the reviewer, and going forward, we’re putting in a final check involving randomly sprinkling a handful of lower ranked points into the list so that we have a quantitative signal on reviewer disagreement.
You mentioned that this system has been deployed for two years. Could you talk a bit about that deployment, how it’s gone, and any lessons that you’ve learned?
Deploying a functional system was always the final test for my research. Many proposed monitoring systems in research are by and for machine learning engineers or statisticians — but because they’re not necessarily useful for their users, they get abandoned. Working as a data reviewer during the pandemic and being faced with tens of thousands of alerts daily made it clear that existing systems weren’t working. It’s how I knew a fully different approach was needed on the scalability front, and that it had to be developed through an interdisciplinary lens to be aligned with user needs.
The most important lessons I learned were in tradeoffs. One of the first prototypes involved a deep learning forecasting model and only gave the data reviewers a list of indexes to look up. Turns out that this was undesirable for both our engineering team for the compute costs and domain experts from an interpretability perspective even though it was marginally more accurate.
What are the next steps now that you’ve finished your PhD? Are you continuing to work at Carnegie Mellon?
Right now, public health data availability is actually shrinking and becoming less consistent. I’m staying on briefly as a postdoc to study how well the system works in practice under these conditions, which is pretty exciting.
Then, in August I’m going to be starting as an Assistant Professor at Johns Hopkins, and I’m looking forward to researching core computational questions with clinical impacts.
What was it that inspired you to study AI and, particularly, applying it to healthcare?
I started out as a computer systems researcher because I loved the complexity and challenge of developing and analyzing new algorithms. At the same time, I wanted my work to be helpful, especially if it could be used to improve human health. I was lucky that I found a way to bring together my computational skills and passions through AI research. In fact, I learned about extreme value theory in the context of failure rates in computational systems, and I only realized it should be used in this setting once I understood that public health experts were having problems ranking the largest ‘failures’ based on their data. And for me, seeing my computational research improving outcomes in practice was the most rewarding part of my PhD.
Could you talk a bit about the Doctoral Consortium experience at AAAI 2025?
The Doctoral Consortium made it clear that AAAI prioritizes supporting early scientists and researchers. I was surprised by how much time and effort senior researchers took to mentor PhD students and the interest they took in each of our career trajectories. I also really appreciated the opportunity to meet my peers and learn about their research, and to stay in contact with them.
For anyone considering applying, I think It’s a great opportunity to ask questions about future research paths and the direction of AI research going forward.
Have you got any advice you’d give to someone who’s thinking of doing a PhD?
One of the senior researchers from the doctoral consortium told us, “You have to advocate for your work.”
I’ve found this to be true. I keep researching AI problems that will improve human health because I believe these problems are important to address. The best guidance I’ve received on how to champion this type of research effectively is by balancing persistence and flexibility, which I try to do in my research and career.
Finally, do you have an interesting fact about you?
I started martial arts during my PhD. Having a challenging hobby always gave me something to work towards!
About Ananya

|
Ananya Joshi is an incoming Assistant Professor at Johns Hopkins. In her doctoral research, she developed a human-in-the-loop system and related methods that are used daily by public health domain experts to identify and diagnose data events from large volumes of streaming data. Her work was supported through the NSF GRFP and has been recognized through Rising Stars programs, CMU’s 3 Minute Thesis competition, computer science and public health venues, and a Graduate Student service award. |
tags: AAAI, AAAI Doctoral Consortium, AAAI2025, ACM SIGAI
AUAI is supported by: