
ΑΙhub.org
Rethinking benchmark systems for machine learning
Common methods applied in the evaluation of model performance share several limitations. A new meta-measure Elo-based Predictive Power (EPP) method addresses these issues.
How do we compare machine learning algorithms?
There are many approaches to verify whether a new algorithm improves the performance compared to the previous state-of-the-art algorithms. The majority of them are testing procedures. In his paper Statistical Comparisons of Classifiers over Multiple Data Sets, Janez Demšar reviewed commonly used practices and pointed out the vast amount of problems with them. He analyzed papers from five International Conferences on Machine Learning (1999-2003) that compared at least two classification models. The authors of the conference papers were using a wide range of approaches, from computing average accuracy, through counting the number of times a classificator performed better than the others, to assessing statistical significance by pairwise t-tests. The conclusion of the analysis made by Demšar was that there is no well-established procedure for comparing algorithms over multiple data sets. Moreover, many of the authors used statistical methods while assumptions, for example about the distribution, were not met.
What can be done to overcome such problem with evaluating whether one new algorithm performs better than others? What can be done for benchmarking many of the algorithms?
Since 2013 there have been a number of approaches to benchmarking machine learning algorithms. Researchers from the area of Natural Language Processing (NLP) have provided and developed many platforms to compare state-of-the-art models. GLUE and SuperGLUE benchmarks contain most of the existing NLP tasks and rank algorithms based on results from all of those tasks. Yet, different tasks have different measures that are incomparable between tasks. Another field of study is benchmarking interpretable NLP models with several metrics that capture how well the rationales provided are consistent with human rationales; an example of such a benchmark is ERASER. Of course, there are benchmarks in many fields other than NLP. Papers With Code is a large base of papers with model rankings and comparison plots for many problems, such as computer vision, natural language processing, speech recognition, and time series. Another source with a broad view of model performance is the OpenML database. Open ML contains a wide range of data sets for both supervised and unsupervised problems followed by the performance of many machine learning models on those data sets.
Yet, all of the benchmarks are dependent on the choice of the performance measure. Can we compare measure values between datasets or even between models? We are going to show that this may not be a good idea using current methods.
What is wrong with the most common performance measures?
1) The existing machine learning rankings are based on ordering according to popular performance measures. An example of Kaggle ranking is presented in figure 1. The difference between the AUC (area under the curve) of the first and AUC of the second model equals 0.00018. What can we infer from this absolute difference?
The AUC score is useful for ordering, but its differences have no interpretation. It does not provide any quantitative comparison of models’ performances. There is no one established way to compare the power of enhancement of performance measures. Someone would say we should equate absolute differences regardless of the absolute values of the score while someone else would say we should analyze relative improvement. Both ways may lead to opposite conclusions, depending on the absolute value of the performance measure.


2) In figures 1 and 2 differences between the second and third best models for each data set are around 0.00008. One would like to know whether these differences are comparable between data sets. Does 0.00008 on Springleaf marketing data mean the same increase of model quality on IEEE-CIS fraud data? There are at least three points of view. One is that the gaps are almost the same for both data sets because the differences in AUC are almost similar. Second is that the gap in the IEEE-CIS fraud competition is larger as the AUC is close to 1. Relative improvement for fraud detection ((0.967722−0.967637)/(1−0.967722)≈0.0026) is larger than relative improvement for Springleaf marketing (0.80907−0.80899)/(1−0.80907)≈0.0004). The third point of view is that the gap between first and second place for Springleaf (0.00018) is smaller than the same difference for IEEE-CIS fraud detection (0.000415). Therefore, the relative gain from the difference between the second and third place for Springleaf is higher.
Elo-based Predictive Power (EPP) score
The Elo rating is a ranking system used for calculating the relative level of players’ skill. It is used in sports, for example, chess and football. The difference between Elo ratings of two players can be transferred into probabilities of winning when they play against each other. Therefore the difference in Elo scores is a predictor of the match result calculated on the basis of the history of players’ matches. The most important property of the Elo score is the possibility of interpreting them in terms of the probability of winning.
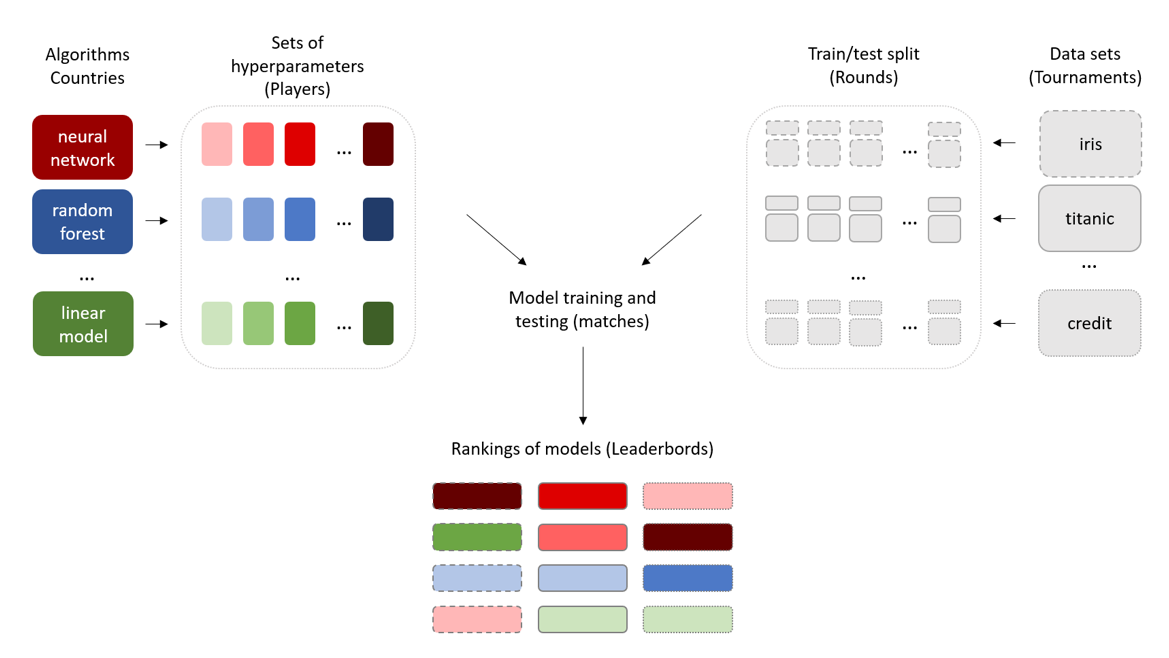
Our idea is to transfer the way players are ranked in the Elo system to create rankings of models. In figure 3, we present the concept of an Elo-based comparison of machine learning algorithms. We describe the ratings of models as an analogy to the tournaments with the Elo system. Each data set (tournament) is processed independently. Algorithms (countries) are staging their sets of hyperparameters (players) for duels. These duels are held within the data sets (tournaments) divided into train/test splits (rounds). The measures of model performances, such as AUC on bootstrap test splits (results of matches), are aggregated into the meta measure EPP. The final ranking of models (leaderboards) is based on the EPP. Each ranking is related to a single data set. The output rankings can be analyzed according to the type of algorithm, a specific set of hyperparameters, or a particular data set. We use the same sets of hyperparameters for different data sets, which allows for paired-sample analysis.
Going back to the problems with the most common performance measures:
- The EPP score provides a direct interpretation in terms of probability. The difference of EPP scores for models is the logit of the probability that one model achieves better performance than another.
- The EPP score enables us to compare the relative improvement of model predictive power between data sets. The difference of EPP scores for models, even for different tasks, has the same probabilistic interpretation.
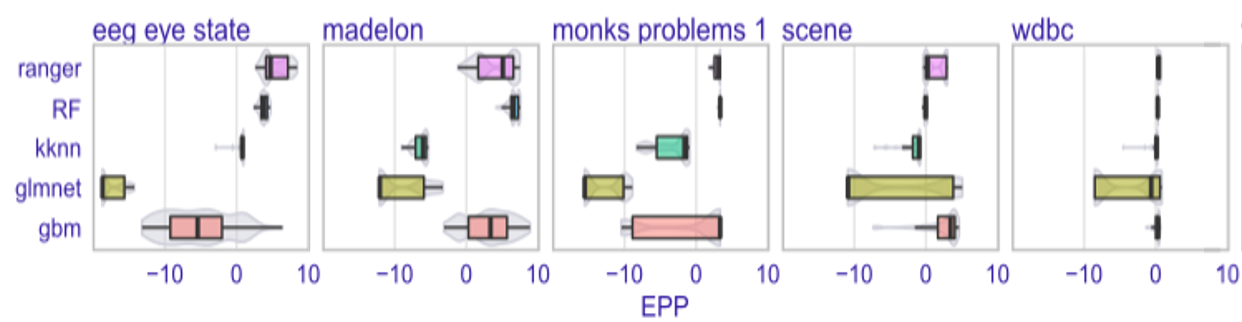
In Figure 4, there are distributions of EPP scores across different classes of models and data sets. Each box plot consists of EPP scores for different hyperparameters settings. For example, box plot labeled ranger shows the distribution of EPP scores for all considered random forests, differing in hyperparameters, such as the number of trees or split rule.
What else can you do with EPP?
Due to the interpretation of differences and comparability of EPP across diverse data sets, this new measure provides the opportunity to research and verify state-of-the-art AutoML benchmarks in a new light. Properties of the EPP score overcome objections relating to existing metrics. Hence EPP may be considered as competitive to commonly applied ranking systems used for data science and machine learning challenges. Another benefit of EPP is the possibility to transform differently defined evaluation scores to the same scale. Therefore, the EPP provides a way to unify benchmarks, such as GLUE, SuperGLUE, or ERASER.
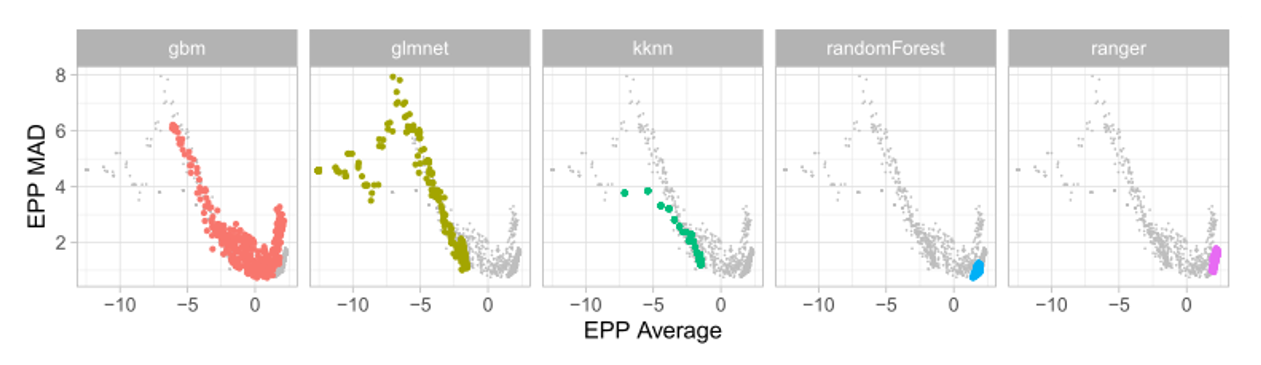
What is more, EPP scores can be compared across different data sets; therefore EPP makes it possible to create embeddings of models that contain information on how the model works on different types of data sets. Figure 5 shows an example representation of algorithms in the space of data sets.
Read the preprint on arXiv
To learn more about EPP and its applications we encourage you to read our arXiv preprint.
Interpretable Meta-Measure for Model Performance
Gosiewska, A., Woznica, K., & Biecek, P. (2020)
tags: herotagrc


AUAI is supported by: