
ΑΙhub.org
Compression, transduction, and creation: a unified framework for evaluating natural language generation
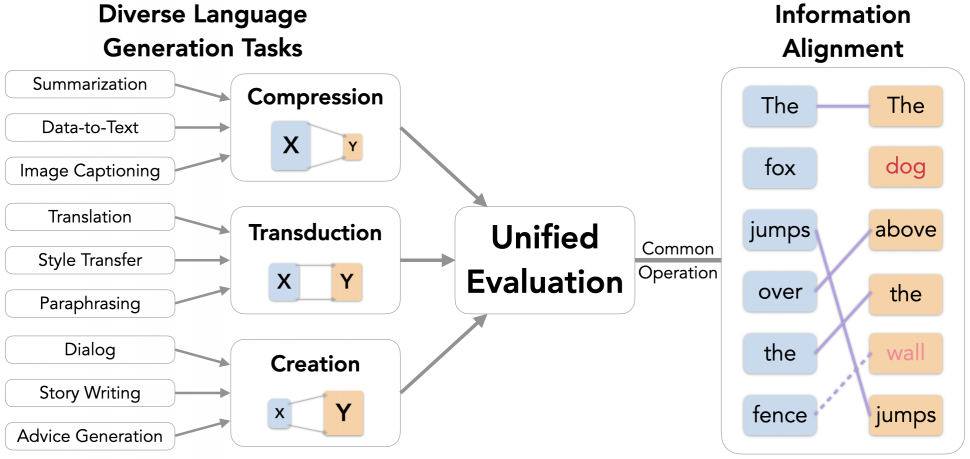
Figure 1: Our framework classifies language generation tasks into compression, transduction, and creation (left), and unifies the evaluation (middle) of key quality aspects with the common operation of information alignment (right).
By Mingkai Deng
TL;DR: Evaluating natural language generation (NLG) is hard. Our general framework helps solve the difficulty by unifying the evaluation with a common central operation. Inspired metrics achieve SOTA correlations with human judgments on diverse NLG tasks. Our metrics are available as library on PyPI and GitHub.
Natural language generation (NLG) refers to a wide range of tasks that produce fluent text from input data and other contextual information. In practice, these tasks often have very different goals in mind. Some well-known examples include the following:
- Summarization: Compress a source article into a short paragraph containing the most important information.
- Translation: Convert content expressed in one language into another.
- Dialog: Create novel responses to drive the conversation.
In recent years, we have seen remarkably fast progress in improving and designing new models for various such tasks. However, evaluation of NLG is still difficult: Human judgment is considered the gold standard but is often expensive and slow to collect. Automatic evaluation, on the other hand, is scalable, but messy and challenging. This difficulty stems precisely from the heterogeneity we mentioned earlier: each task has different desired quality aspects which makes it difficult to determine what to measure and how.
Previous work has developed a multitude of evaluation metrics based on specific intuitions for specific tasks and aspects. However, there is a need for a more general theoretical ground in order to reason about what to evaluate, and how to evaluate a given task. This will make it easier to share evaluation ideas and methods across diverse NLG problems which in turn can provide better guidance towards metric design for emerging domains.
In our EMNLP 2021 paper, we move towards this direction by proposing a unified framework for NLG evaluation that facilitates the design of metrics for a wide range of language generation tasks and aspects. Our contributions are as follow:
- What to evaluate: Based on information change from input (
 ) to output (
 ), we classify NLG tasks as one of compression (
 ), transduction (
 ) and creation (
 ). Each category calls for its own priorities and desired output qualities.
 - How to evaluate: We find that the information alignment, or overlap, between generation components (e.g., input, context, and output) plays a common central role in characterizing generated text.
- Uniform metric design: We develop a family of evaluation metrics for diverse NLG tasks in terms of a uniform concept of information alignment. These metrics are intuitive, interpretable and often don’t need gold human references. To operationalize these metrics, we formulate alignment estimation as a prediction task and propose several methods to solve it.
Our proposed framework has the following advantages for NLG evaluation:
- Shared improvements: Improvement in one single alignment estimation model can immediately benefit a wide range of metrics defined under our framework.
- Strong performance: Experiments show that our uniformly designed metrics outperform or compete with state-of-the-art metrics in each of diverse tasks, including text summarization, style transfer, and knowledge-grounded dialog.
- Composable software: With information alignment as the intermediate representation, we deliver a composable library for easy NLG evaluation and future metric design.
Our code and metric API are available here.
Difficulties with NLG Evaluation
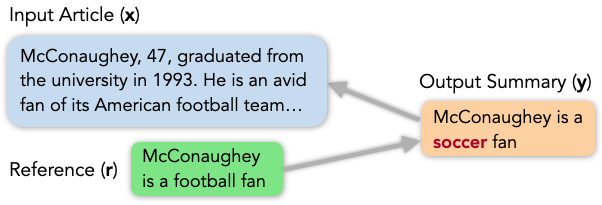
We illustrate the complexity of NLG evaluation with the following example from summarization. Given an input article, we want to compare the quality of two output summaries. A popular approach is to measure their similarities to a gold reference written by a human annotator. To be concrete, we use ROUGE-1, a de-facto standard evaluation metric for summarization that computes the summaries’ word overlap with the reference, as we show below:
Article: McConaughey, 47, graduated from the university in
1993. He is an avid fan of its American football team…
Gold Reference: McConaughey is a football fan
Summary 1: McConaughey is a soccer fan (ROUGE-1 = 0.8)
Summary 2: McConaughey graduated from the university in 1993
(ROUGE-1 = 0.17)
In the example above, Summary 1 is almost identical to the Gold Reference, receiving a ROUGE-1 score of 0.8, but it makes a factual error by mistaking “American football” for “soccer” (in red), which calls into question the robustness and perhaps more seriously, safety of the system that produced it. In contrast, Summary 2 is quite different from the Gold Reference and only receives a ROUGE-1 score of 0.17, but its content is fully consistent with the Article. The low score, therefore, reveals an inability to select important information rather than failure to follow the article. While these quality nuances are important to evaluating outputs and diagnosing systems, simply comparing with the reference cannot account for all the key aspects.
Trying to mitigate this shortfall of reference-based evaluation, previous work considered a diverse array of quality aspects and proposed a zoo of evaluation metrics. Some examples of both are shown in the word cloud below:
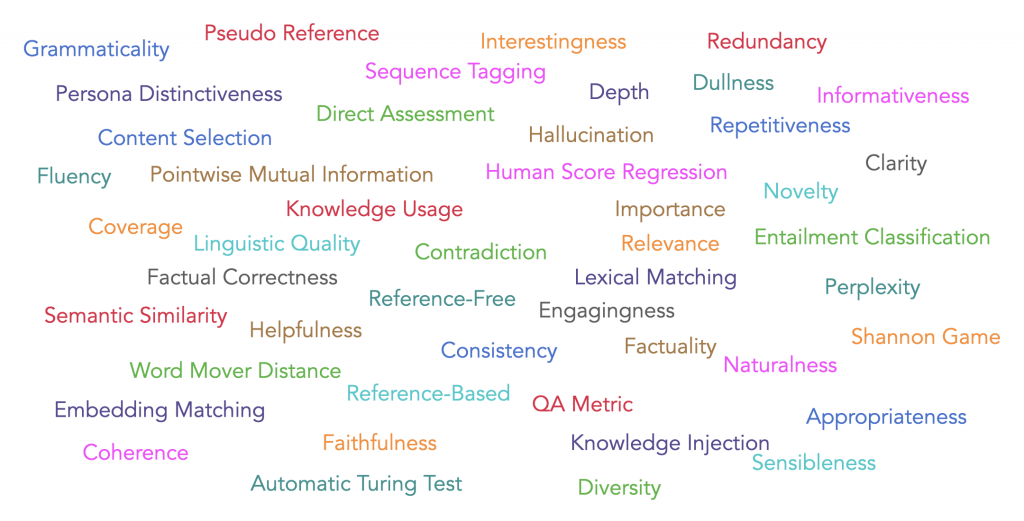
Despite the progress, most of the aspects and metrics are proposed based on specific intuitions for specific tasks. Our contribution is in providing a unified perspective that leads to a general methodology that facilitates metric design for all types of tasks.
A Unified Evaluation Framework
We begin by introducing our perspective on NLG in terms of information change, or change in the amount of information from input to output. Based on practical use, an NLG task can be seen as performing one of compression, transduction, or creation on the input. Each category implies different operations, requirements, and evaluation intuitions, as we illustrate and describe below:
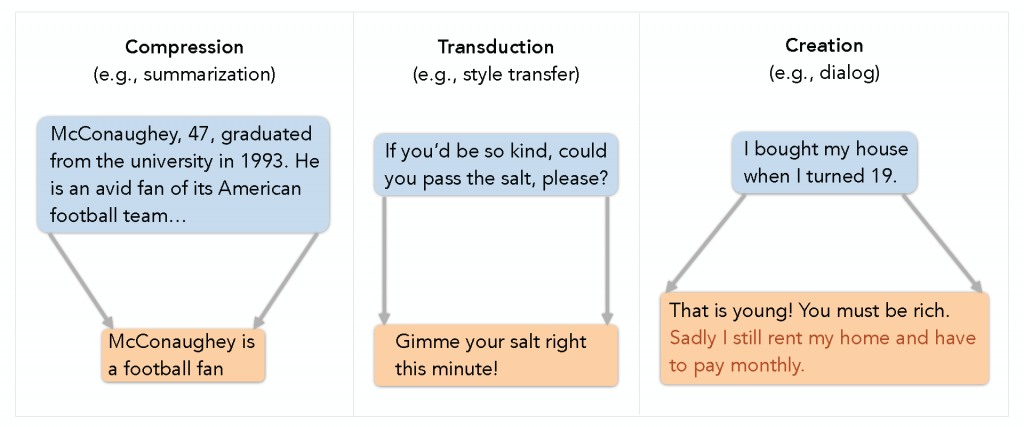
- Compression: Express salient information in concise text.
Examples: Summarization, data-to-text and image captioning.
Requirements: Output must 1) only contain only information from the input (consistency) and 2) the included content should be salient (relevance).
Measurement: Consider the information alignment, or overlap, between the output and the input (and reference which offers clues of salience). - Transduction: Transform text while preserving content precisely.
Examples: Translation, paraphrase and style transfer.
Requirements: Output must preserve the input’s meaning precisely.
Measurement: Consider the information alignment between input and output. - Creation: Produce new content based on input and context.
Examples: Dialog and story generation.
Requirements: Output must 1) engage with the input (e.g. dialog history) and 2) add meaningful information by grounding in external context (e.g. knowledge snippets, persona statements).
Measurement: Consider the information alignment between input, external sources and output.
As shown above, each broad task category implies its own desired qualities. However, the notion of information alignment arises as a unifying component for evaluation across the tasks. A single accurate alignment model would readily enable us to evaluate the relevant aspects in various applications.
Next, we will present our definition of information alignment and describe how we build aspect metrics for compression, transduction, and creation based on this alignment. After that, we discuss our effective implementations of the alignment model based on powerful pre-trained neural networks.
Information Alignment
Definition: We consider information alignment in NLG as token-level soft alignment. We assume each token to be a word below for clarity, but our approach generalizes to other forms of sequential data as well. Given any text  with
with  words and arbitrary data
  , the information alignment from to is a vector of alignment scores:
![\[align(\mathbf{a} \to \mathbf{b}) = \langle \alpha_1, \alpha_2, …, \alpha_N \rangle\]](https://aihub.org/wp-content/ql-cache/quicklatex.com-622002f12a2b8af448334bb40a9b12f5_l3.png "Rendered by QuickLaTeX.com")
where ![\alpha_i \in [0, 1]](https://aihub.org/wp-content/ql-cache/quicklatex.com-0939fb8de51bb02d844881995c43d560_l3.png "Rendered by QuickLaTeX.com") is the confidence that the information in the
is the confidence that the information in the  -th word of is grounded in . i.e. the word aligns with . The criteria for alignment can be as simple as finding the same word in , but can also be as complex as the prediction of a neural network. Note that the alignment here only needs to be one-directional from to – it doesn’t necessarily measure how aligns to . Below is an illustration of our formulation:
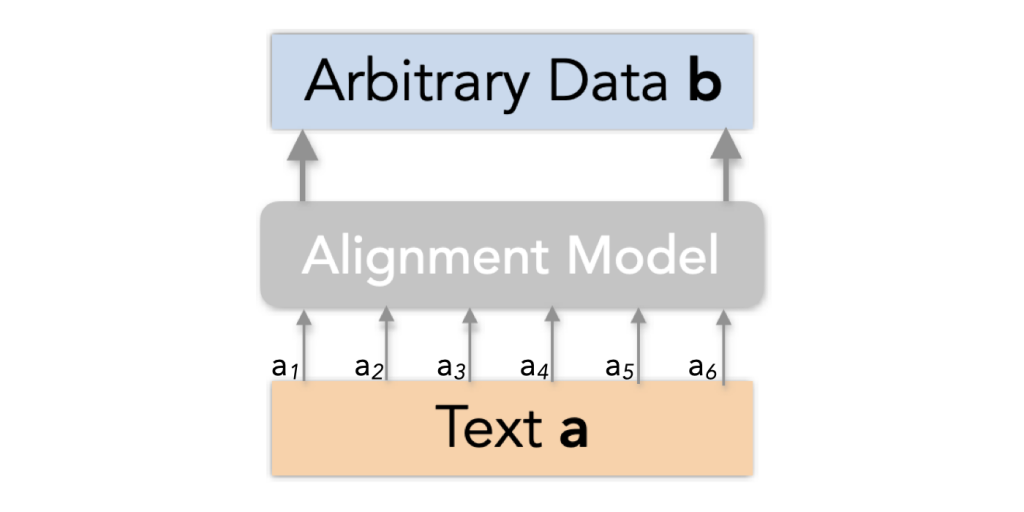 receives a score for how well it’s grounded in arbitrary data . To compute the scores, we employ trained alignment models distinct from the model that generated .
To compute information alignment, we formulate its estimation as a prediction problem and propose alignment models distinct from text generation models, which we describe in more detail later.
Many previous evaluation metrics (e.g., BLEU, ROUGE, and recent QA metrics) can be viewed as instances of our framework, where they implement the information alignment in one way or another. We are, however, the first to explicitly bring up this core concept, which inspires us to model it more directly and achieve better performance.
As we will show, by measuring the information alignment vectors between relevant generation components (e.g., input, context, and output) and aggregating them appropriately (e.g., mean and sum), we can define intuitive metrics for various tasks. The fine-grained alignment scores also offer a certain level of interpretability for the resulting metrics.
Metric Definitions
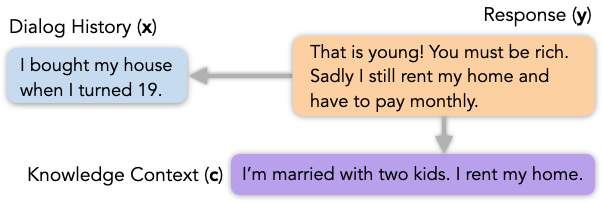
Preliminaries: For an NLG task, let be the input,  be any other additional context, and be the output text generated by conditioning on both and . For example, in knowledge-based dialog, is the dialog history, is the external knowledge such as a Wikipedia article, and is the response.
In our current work, we assume both and to be text, but the general framework is still applicable when they are in other modalities (e.g., images, tables) as long as we can measure their information alignment with as defined above (e.g., using cross-modal models). In some tasks, gold-standard outputs written by humans are available, which we denote as  .
.
In the subsections below, we define the aspect-specific metrics uniformly in terms of information alignment. The detailed intuitions and discussions on these metrics can be found in Section 3 of our paper.
Compression Tasks: Consistency and Relevance
e.g., summarization:
![\[\begin{aligned} {\rm C{\small ONSISTENCY}}(\mathbf{y}, \mathbf{x}) &= \mathrm{mean}(\textit{align}(\mathbf{y} \to \mathbf{x})) \\{\rm R{\small ELEVANCE}}(\mathbf{y}, \mathbf{x}, \mathbf{r}) &= \mathrm{mean}(\textit{align}(\mathbf{r} \to \mathbf{y})) \times \mathrm{mean}(\textit{align}(\mathbf{y} \to \mathbf{x})) \end{aligned}\]](https://aihub.org/wp-content/ql-cache/quicklatex.com-b356b9b7ee6e6de4a01bda3256f466d6_l3.png "Rendered by QuickLaTeX.com")
Transduction Tasks: Preservation
e.g., text style transfer:
![\[\begin{aligned}{\rm P{\small RESERVATION}}(\mathbf{y}, \mathbf{x}) = \frac{ \mathrm{mean}(\textit{align}(\mathbf{y} \to \mathbf{x})) \times \mathrm{mean}(\textit{align}(\mathbf{x} \to \mathbf{y})) }{ \mathrm{mean}(\textit{align}(\mathbf{y} \to \mathbf{x})) + \mathrm{mean}(\textit{align}(\mathbf{x} \to \mathbf{y})) }\end{aligned}\]](https://aihub.org/wp-content/ql-cache/quicklatex.com-bbd5cda5496f2f75fc6fd86aa940c15c_l3.png "Rendered by QuickLaTeX.com")
Creation Tasks: Engagingness and Groundedness
e.g., knowledge-based dialog:
![\[\begin{aligned}{\rm E{\small NGAGINGNESS}}(\mathbf{y}, \mathbf{x}, \mathbf{c}) &= \mathrm{sum}(\textit{align}(\mathbf{y} \to [\mathbf{x}, \mathbf{c}])) \\{\rm G{\small ROUNDEDNESS}}(\mathbf{y}, \mathbf{c}) &= \mathrm{sum}(\textit{align}(\mathbf{y} \to \mathbf{c})) \\end{aligned}\]](https://aihub.org/wp-content/ql-cache/quicklatex.com-f7649d9e5fc32ce1f3454a8a508d21c9_l3.png "Rendered by QuickLaTeX.com")
Implementation of Alignment Estimation
In the above sections, we have presented the metrics for a range of key aspects in different tasks, building on the core concept of information alignment measure. We next discuss our three effective implementations for measuring the alignment scores between text, including embedding matching, discriminative model, and aggregated regression, all based on pre-trained language models, as we illustrate in the figure below.

Embedding Matching (E): One simple way to estimate the text-to-text alignment vector  is by matching the tokens in the two sequences based on their embeddings. Specifically, we first use pre-trained representations from either BERT or RoBERTa to extract contextual embeddings for tokens in
  and
and  . Then, the alignment score of each token in is simply its maximum cosine similarity with tokens in .
Discriminative Model (D): To better estimate the alignment to arbitrary data , we formulate the problem as sequence tagging, and train a token classifier that labels each token in with 1 if it aligns with , and 0 otherwise. The predicted probability of label 1 for each token in serves as the alignment score. We base our model on RoBERTa and train with automatically constructed weak supervision data, which we describe in more detail in our paper‘s appendix.
Aggregated Regression (R): Instead of estimating the per-token alignment vector, we may also directly estimate the final aggregated score such as  (or
(or  . This is because all the metrics proposed above have only used the aggregated score. To this end, we train a regression model with the same weak supervision data but using the aggregated alignment score as the regression target. Similar to Sellam et al. (2020), we implement the regression model with a version of BERT in our experiments. We note that the aggregated estimation method may not be applicable to future metrics in our evaluation framework when fine-grained per-token alignment is required.
Experiments
We evaluate our proposed metrics on commonly used human-annotated datasets for summarization, style transfer, and dialog. To measure a metric’s performance, we compute the sample-level Pearson and Spearman correlations between the metric scores and human judgments on individual generation samples. For baselines, setups, and more detailed comparison, we direct the reader to our paper for details. Additional results such as Kendall-Tau correlations and system-level correlations are also reported in our paper’s appendix.
Compression Metrics
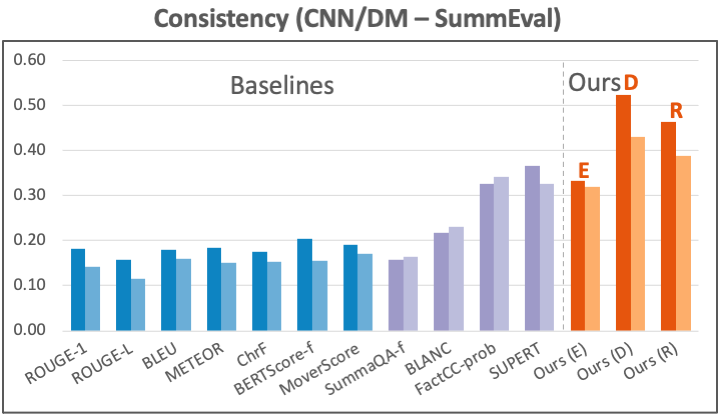
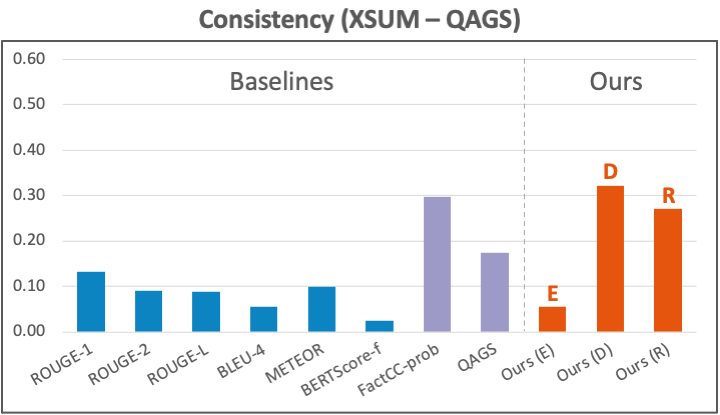
Dataset: For consistency, we evaluate our metric using human annotations from two commonly-used sources: 1) SummEval on the CNN/DM summarization dataset. 2) QAGS on the XSUM dataset, another summarization task. This source also contains annotations on the CNN/DM dataset, which we also report on in our paper’s appendix. For relevance, we test our metric using annotations from SummEval on CNN/DM.
Results: Our consistency metric’s results compared to other reference-based (blue) and reference-free (purple) baselines are shown in the figure below. On CNN/DM, our metrics (orange) based on the trained alignment models (D and R) both clearly outperform previous metrics. On XSUM, our D-based metric also achieves the best performance. In comparison, well-known reference-based metrics like ROUGE, BLEU, and BERTScore underperform on this aspect.
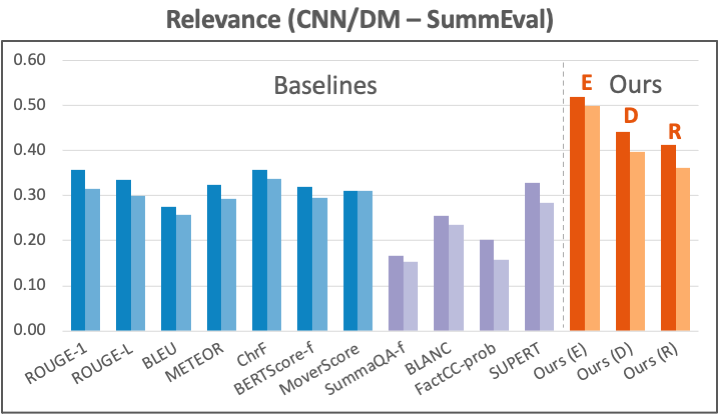
The figure below presents the results for relevance on CNN/DM. Again, our metrics strongly outperform all other baselines, while our E-based implementation performs better than the D– and R-based variants. Note that traditional reference-based metrics perform quite respectably on this aspect, which confirms our hypothesis that reference is important in evaluating the relevance of a summary.
Transduction Metrics
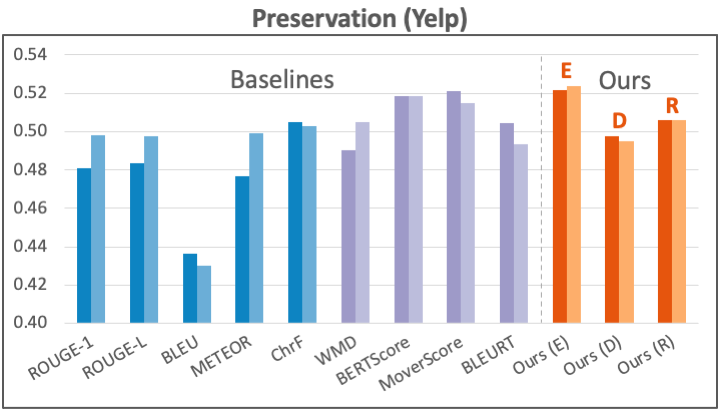
Dataset: We apply our preservation metric to evaluating text style transfer, where we use human annotations from Mir et al. (2019) on the Yelp sentiment transfer data.
Results: We present our preservation results in the figure below. Our metric (E) achieves competitive or better performance than all previous metrics.
Creation Metrics
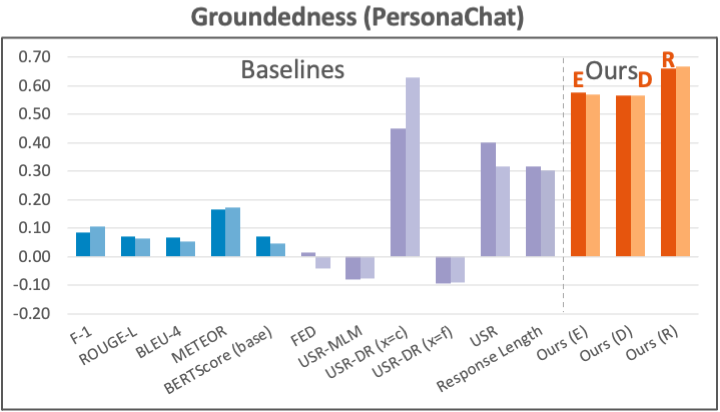
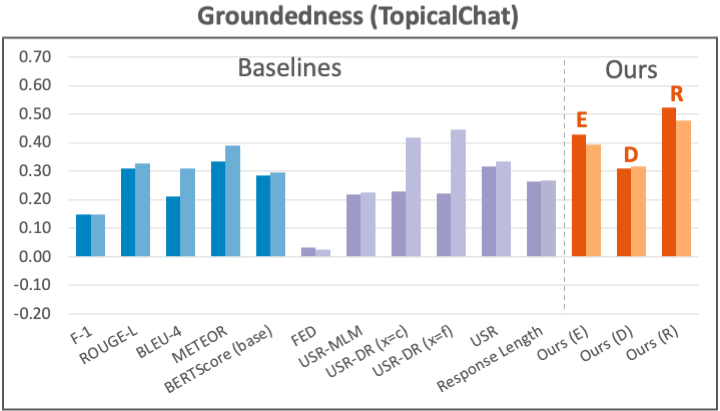
Datasets: For the engagingness aspect, we use the latest human annotation data collected by Mehri and Eskenazi (2020) (which names the aspect “interesting”) on PersonaChat and TopicalChat, two knowledge-grounded dialog tasks with different forms of knowledge. For the groundedness aspect, we again use the previous human annotations (which names the aspect “uses knowledge”) on both PersonaChat and TopicalChat.
Results: We present the results for engagingness in the figure below. Our metrics with different implementations all improve over previous methods by large margins on the two datasets.
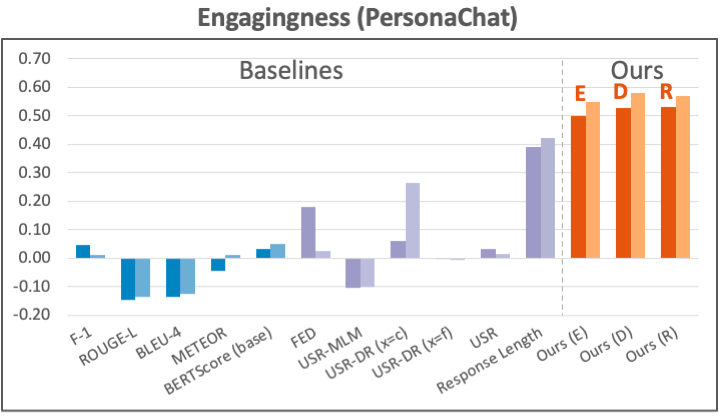
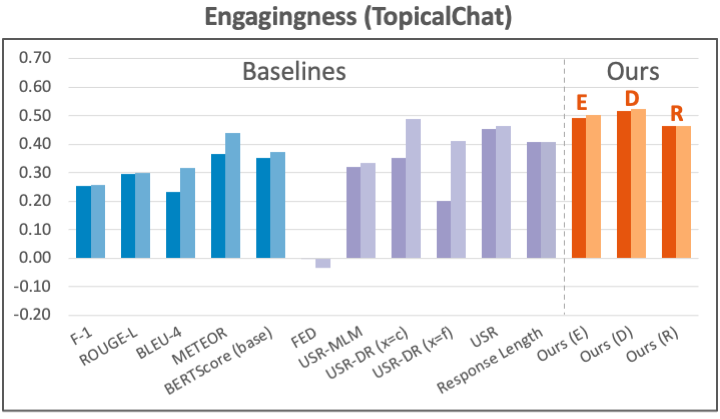
dialog. The plot format is the same as the figures for summarization results.
The results for groundedness are shown in the two plots below. Our metrics again generally achieve strong correlations, with the R-based metric consistently outperforming other implementations.
Higher alignment estimation accuracy, better correlation
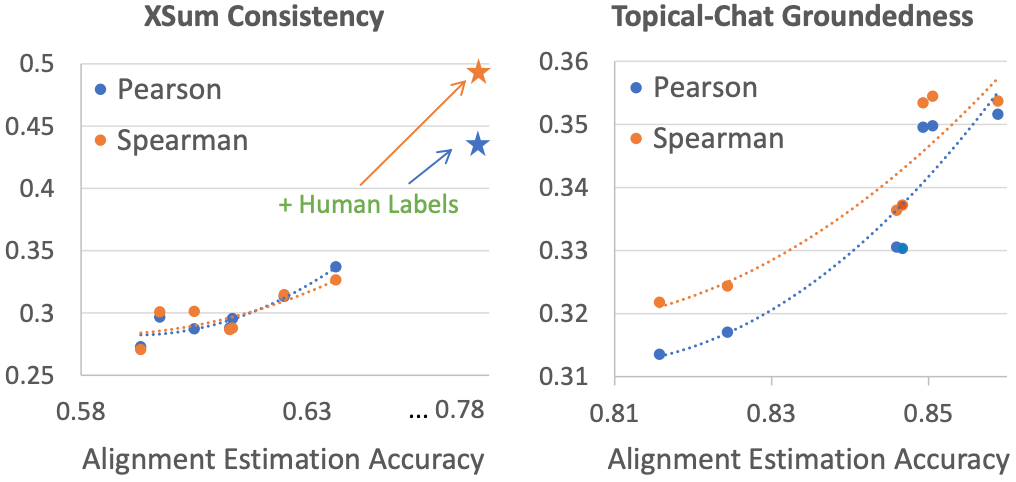
We study how the accuracy of our information alignment estimation influences the performance of our metrics, and demonstrate a highly desirable pattern where higher alignment accuracy usually leads to better correlations. This indicates that improvement in one single alignment estimation model can immediately benefit a broad range of aspect metrics defined under our unified framework.
We use consistency on XSUM and groundedness on TopicalChat as examples, and present their graphs of human correlations vs. alignment estimation accuracy below respectively. To compute the accuracies, we use human-annotated token alignment labels for XSUM collected by Maynez et al. (2020), and auto-constructed pseudo alignment labels for TopicalChat due to availability.
In both cases, as alignment accuracy increases, so does the correlation. Furthermore, as we use part of the XSUM human alignment annotations to finetune our alignment model, we obtain even higher accuracy, which in turn gives better correlation for consistency evaluation (star mark ★ in the figure).
Our metrics are available as API
To access our metrics, simply install our Python package from PyPI by entering pip install ctc_score in the terminal. Alternatively, you can also work with our source code, which is on GitHub.
Below is an example where we evaluate the engagingness of a response from the TopicalChat dataset. To call our metric, we create a DialogScorer object using the D-topical_chat alignment model. Then we specify the engagingness aspect when we call on the scorer to evaluate our response. You can find more descriptions, examples, and interfaces at our GitHub repo.
from ctc_score import DialogScorer

# Topical-Chat
fact = "...Flasher will perform this summer's final Fort Reno "
       "concert in Northwest Washington DC..."

dialog_history = "...Sadly, I haven't been to DC either, "
                 "although I've always wanted to visit there."

response = "I recently met a girl who lives in that area, and "
           "she said the nightlife is worth visiting for..."

# Create the scorer and specify the info alignment model with
# a single line of code
scorer = DialogScorer(align='D-topical_chat')

# Compute the response’s score for the engagingness aspect
score = scorer.score(fact=fact,
                     dialog_history=dialog_history,
                     hypo=response,
                     aspect='engagingness')
Conclusion
We have proposed a general evaluation framework to solve the difficulty of evaluating natural language generation. To summarize:
- We categorize tasks by information change to determine the key aspects to evaluate.
- We find that the notion of information alignment between input, context, output and references is a common central measure for characterizing these different qualities.
- We designed aspect-specific metrics for diverse tasks uniformly in terms of information alignment, most of which do not require access to human references.
- Our uniformly designed metrics achieve superior or comparable human correlations as compared to existing state-of-the-art metrics.
This unified framework not only offers structured guidance to metric design for new aspects and tasks but also opens up exciting possibilities for composable NLG evaluation. Following the more rigorous practices of software engineering, we may divide the process into modular components that can be improved, scaled, and diagnosed independently. We’re excited to explore more in the future.
References
- Jacob Devlin, Ming-Wei Chang, Kenton Lee, and Kristina Toutanova. BERT: Pre-training of deep bidirectional transformers for language understanding. NAACL 2019.
- Alexander R. Fabbri, Wojciech Kry´sci´nski, Bryan McCann, Caiming Xiong, Richard Socher, and Dragomir Radev. 2021. Summeval: Re-evaluating summarization evaluation. ArXiv Preprint.
- Karthik Gopalakrishnan, Behnam Hedayatnia, Qinlang Chen, Anna Gottardi, Sanjeev Kwatra, Anu Venkatesh, Raefer Gabriel, and Dilek Hakkani-Tür. Topical-Chat: Towards Knowledge-Grounded Open-Domain Conversations. Interspeech 2019.
- Chin-Yew Lin. ROUGE: A package for automatic evaluation of summaries. ACL 2004.
- Yinhan Liu, Myle Ott, Naman Goyal, Jingfei Du, Mandar Joshi, Danqi Chen, Omer Levy, Mike Lewis, Luke Zettlemoyer, and Veselin Stoyanov. Roberta: A robustly optimized bert pretraining approach. ArXiv Preprint.
- Joshua Maynez, Shashi Narayan, Bernd Bohnet, and Ryan McDonald. On faithfulness and factuality in abstractive summarization. ACL 2020.
- Shikib Mehri and Maxine Eskenazi. Usr: An unsupervised and reference free evaluation metric for dialog generation. ACL 2020.
- Remi Mir, Bjarke Felbo, Nick Obradovich, and Iyad Rahwan. Evaluating style transfer for text. NAACL 2019.
- Ramesh Nallapati, Bowen Zhou, Cicero dos Santos, Ça˘glar Gu̇lçehre, and Bing Xiang. 2016. Abstractive text summarization using sequence-to-sequence RNNs and beyond. CoNLL 2016.
- Shashi Narayan, Shay B. Cohen, and Mirella Lapata. Don’t give me the details, just the summary! topic-aware convolutional neural networks for extreme summarization. EMNLP 2018.
- Kishore Papineni, Salim Roukos, Todd Ward, and Wei-Jing Zhu. Bleu: a method for automatic evaluation of machine translation. ACL 2002.
- Thibault Sellam, Dipanjan Das, and Ankur Parikh. BLEURT: Learning robust metrics for text generation. ACL 2020.
- Tianxiao Shen, Tao Lei, Regina Barzilay, and Tommi Jaakkola. Style transfer from non-parallel text by cross-alignment. NeurIPS 2017.
- Alex Wang, Kyunghyun Cho, and Mike Lewis. Asking and answering questions to evaluate the factual consistency of summaries. ACL 2020.
- Tianyi Zhang, Varsha Kishore, Felix Wu, Kilian Q. Weinberger, and Yoav Artzi. 2020a. Bertscore: Evaluating text generation with bert.
This article was initially published on the ML@CMU blog and appears here with the authors’ permission.
tags: deep dive

AUAI is supported by: