ΑΙhub.org
Researchers develop machine learning model to improve Amazon carbon storage estimates
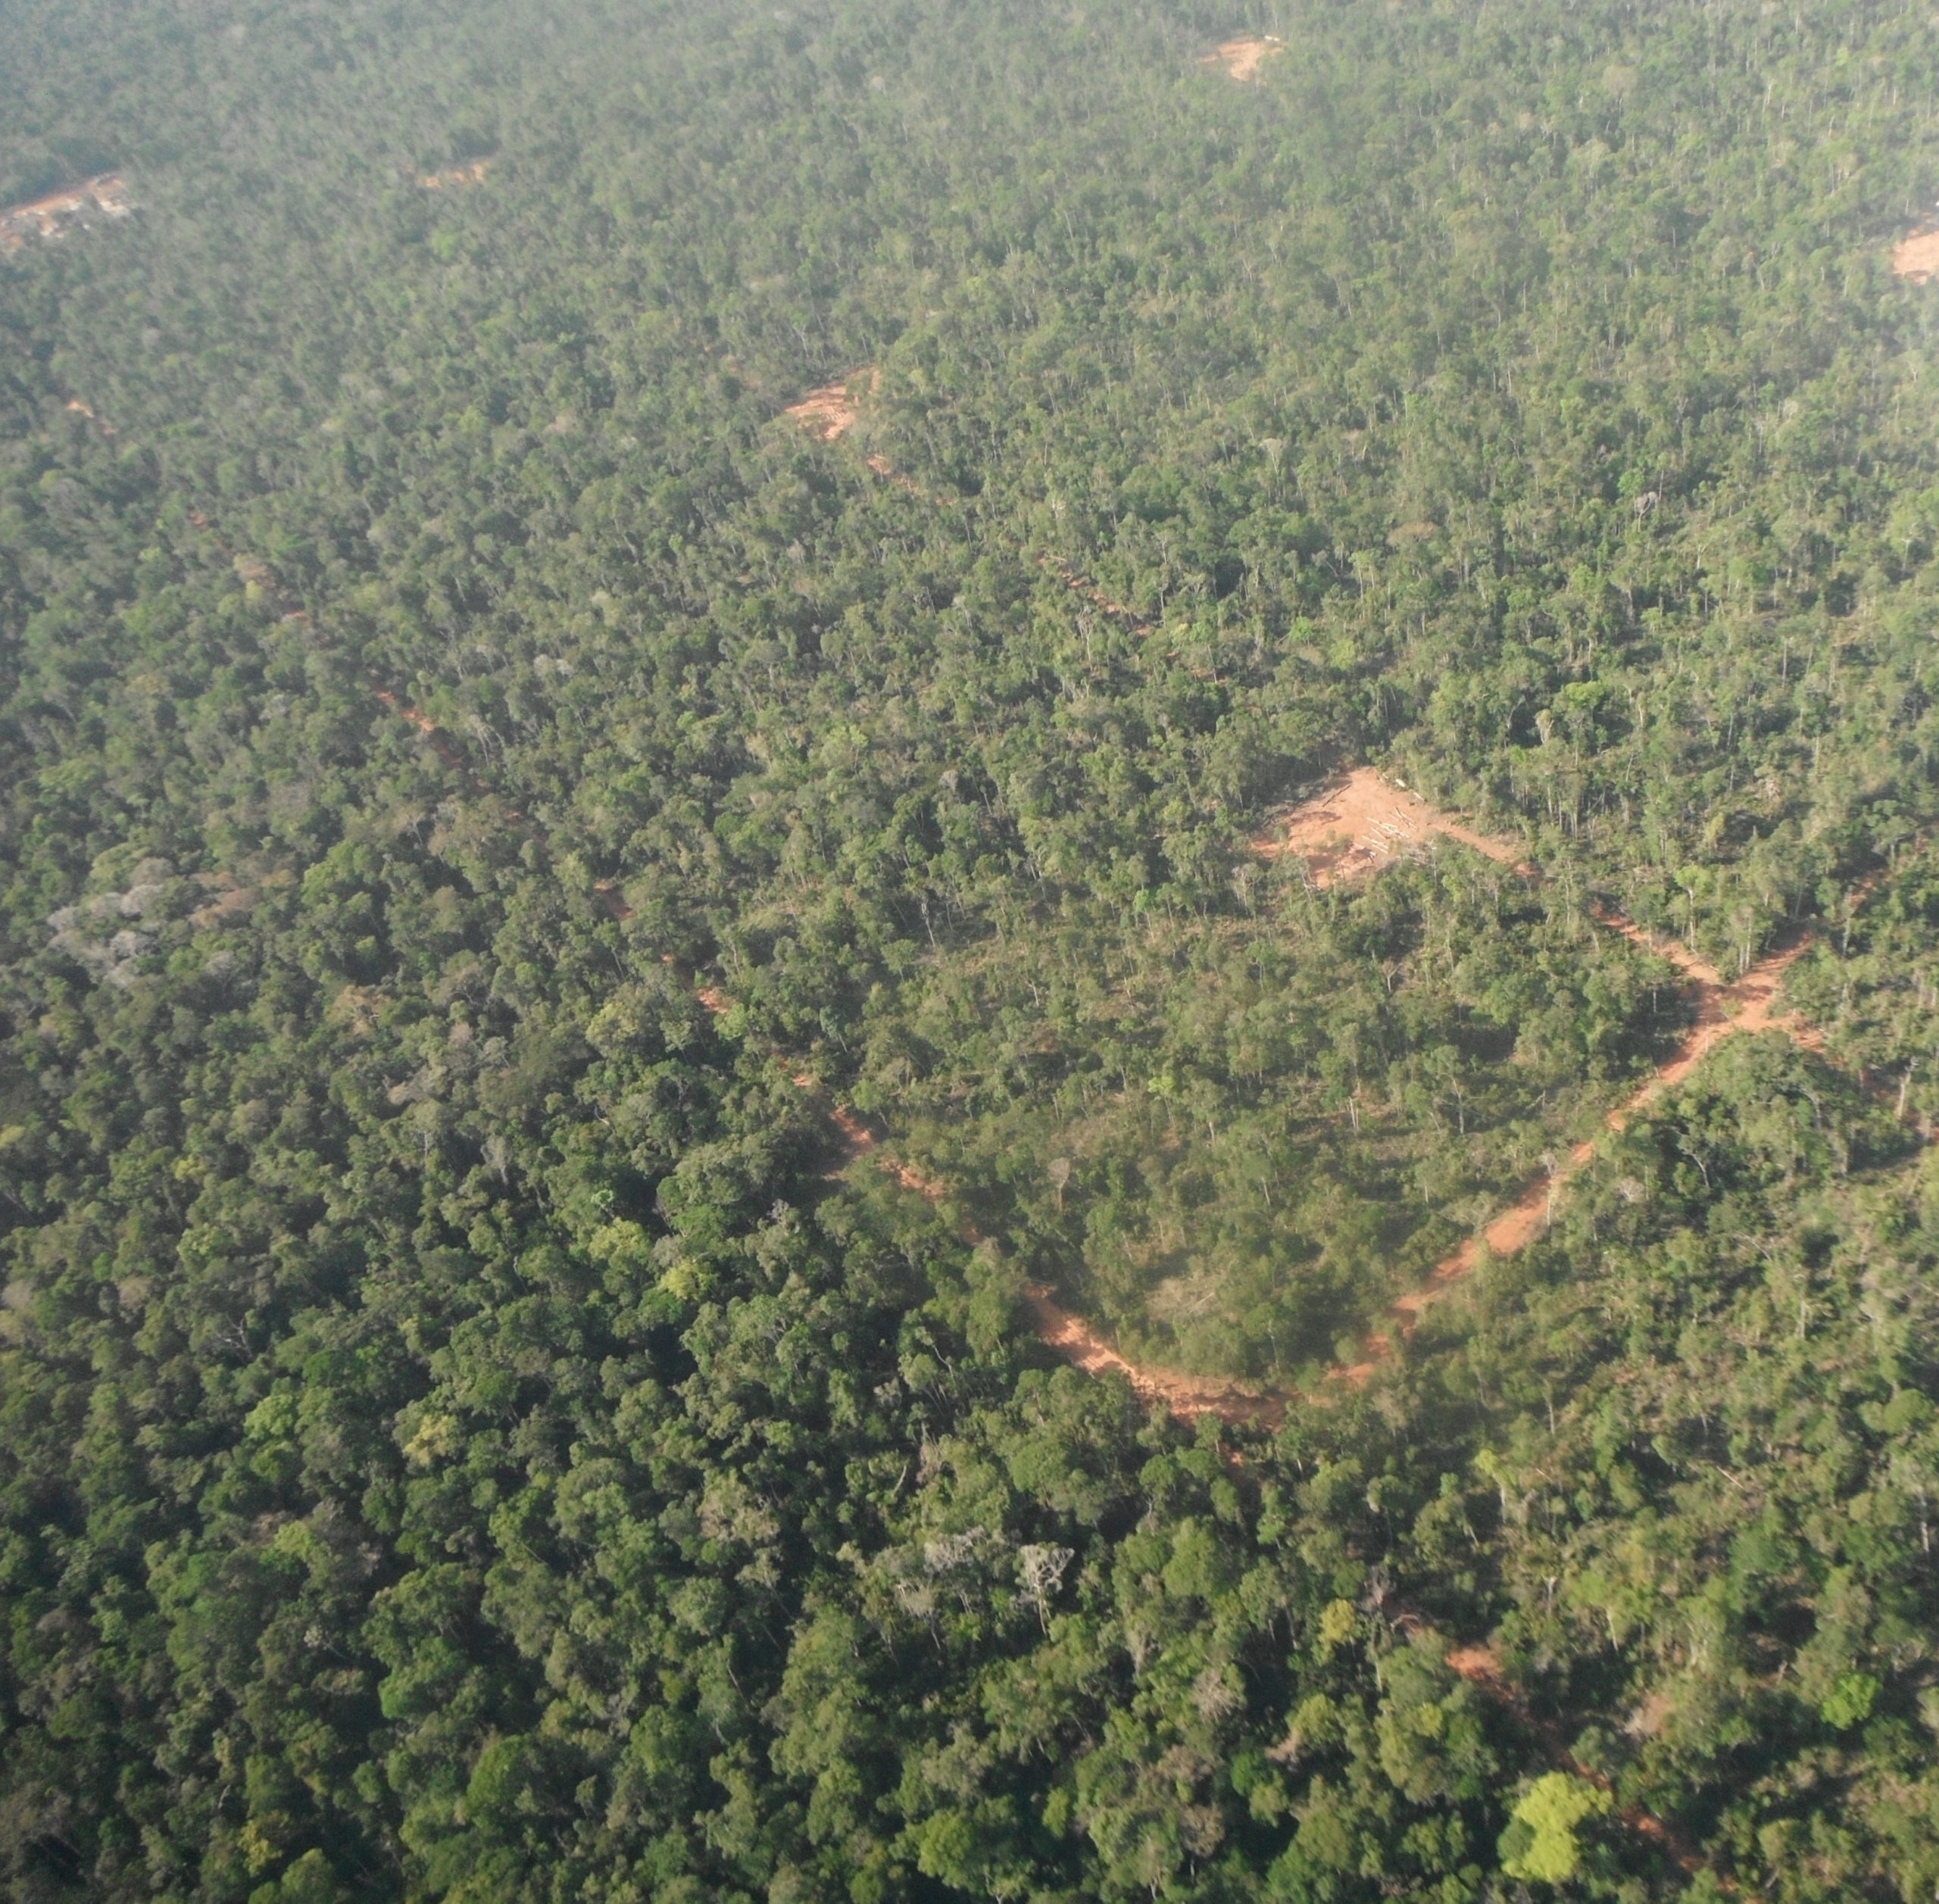
 A logged forest in the Amazon.
By Steve Lundeberg
A collaboration led by Ekena Rangel Pinagé (Oregon State University) has used very-high-resolution satellite imagery to develop a machine learning model that aims to improve climate scientists’ ability to estimate aboveground carbon stocks in the Amazon.
Findings of the study were published in the journal Carbon Balance and Management.
Covering more than 2.5 million square miles in South America, the Amazon is the largest of the world’s tropical forests, which play huge ecological roles for the planet despite covering less than 10% of the Earth’s land area.
More than half of all carbon stored in aboveground biomass is sequestered in tropical rain forests, which are also home to greater than 60% of all terrestrial species. Second growth and degraded forests now cover more area than intact forests, but scientists say the full extent of tropical forest degradation is not completely known.
“Tropical forests are critical for the global carbon budget, and forest degradation through fires and selective logging has been widespread in the Amazon,” said Ekena. “What’s more, there has been a lot of uncertainty regarding land cover classification – categorizing which areas have been logged, which have burned, which are intact forest, which are second growth, etc.”
Ekena and collaborators used commercially available satellites that generate very-high-resolution (VHR) images with pixels at the scale of three square meters. By comparison, satellite imagery produced by Landsat, a long-running partnership between NASA and the U.S. Geological Survey, has a resolution of 30 square meters.
“We also used laser sensors on an aircraft to estimate how much carbon forests lose when they are degraded,” she said. “Deforestation and forest degradation are both substantial sources of carbon to the atmosphere.”
The scientists worked at three study sites in the Brazilian Amazon; two of them were mixtures of intact forest with logged tracts or burned areas, while the third also included some parcels that had been converted to agriculture.
By combining VHR images and laser sensor data, researchers could attribute aboveground carbon stock changes to specific types of forest degradation and determine how much of the greenhouse gas carbon dioxide was released to the atmosphere by either logging or fire events.
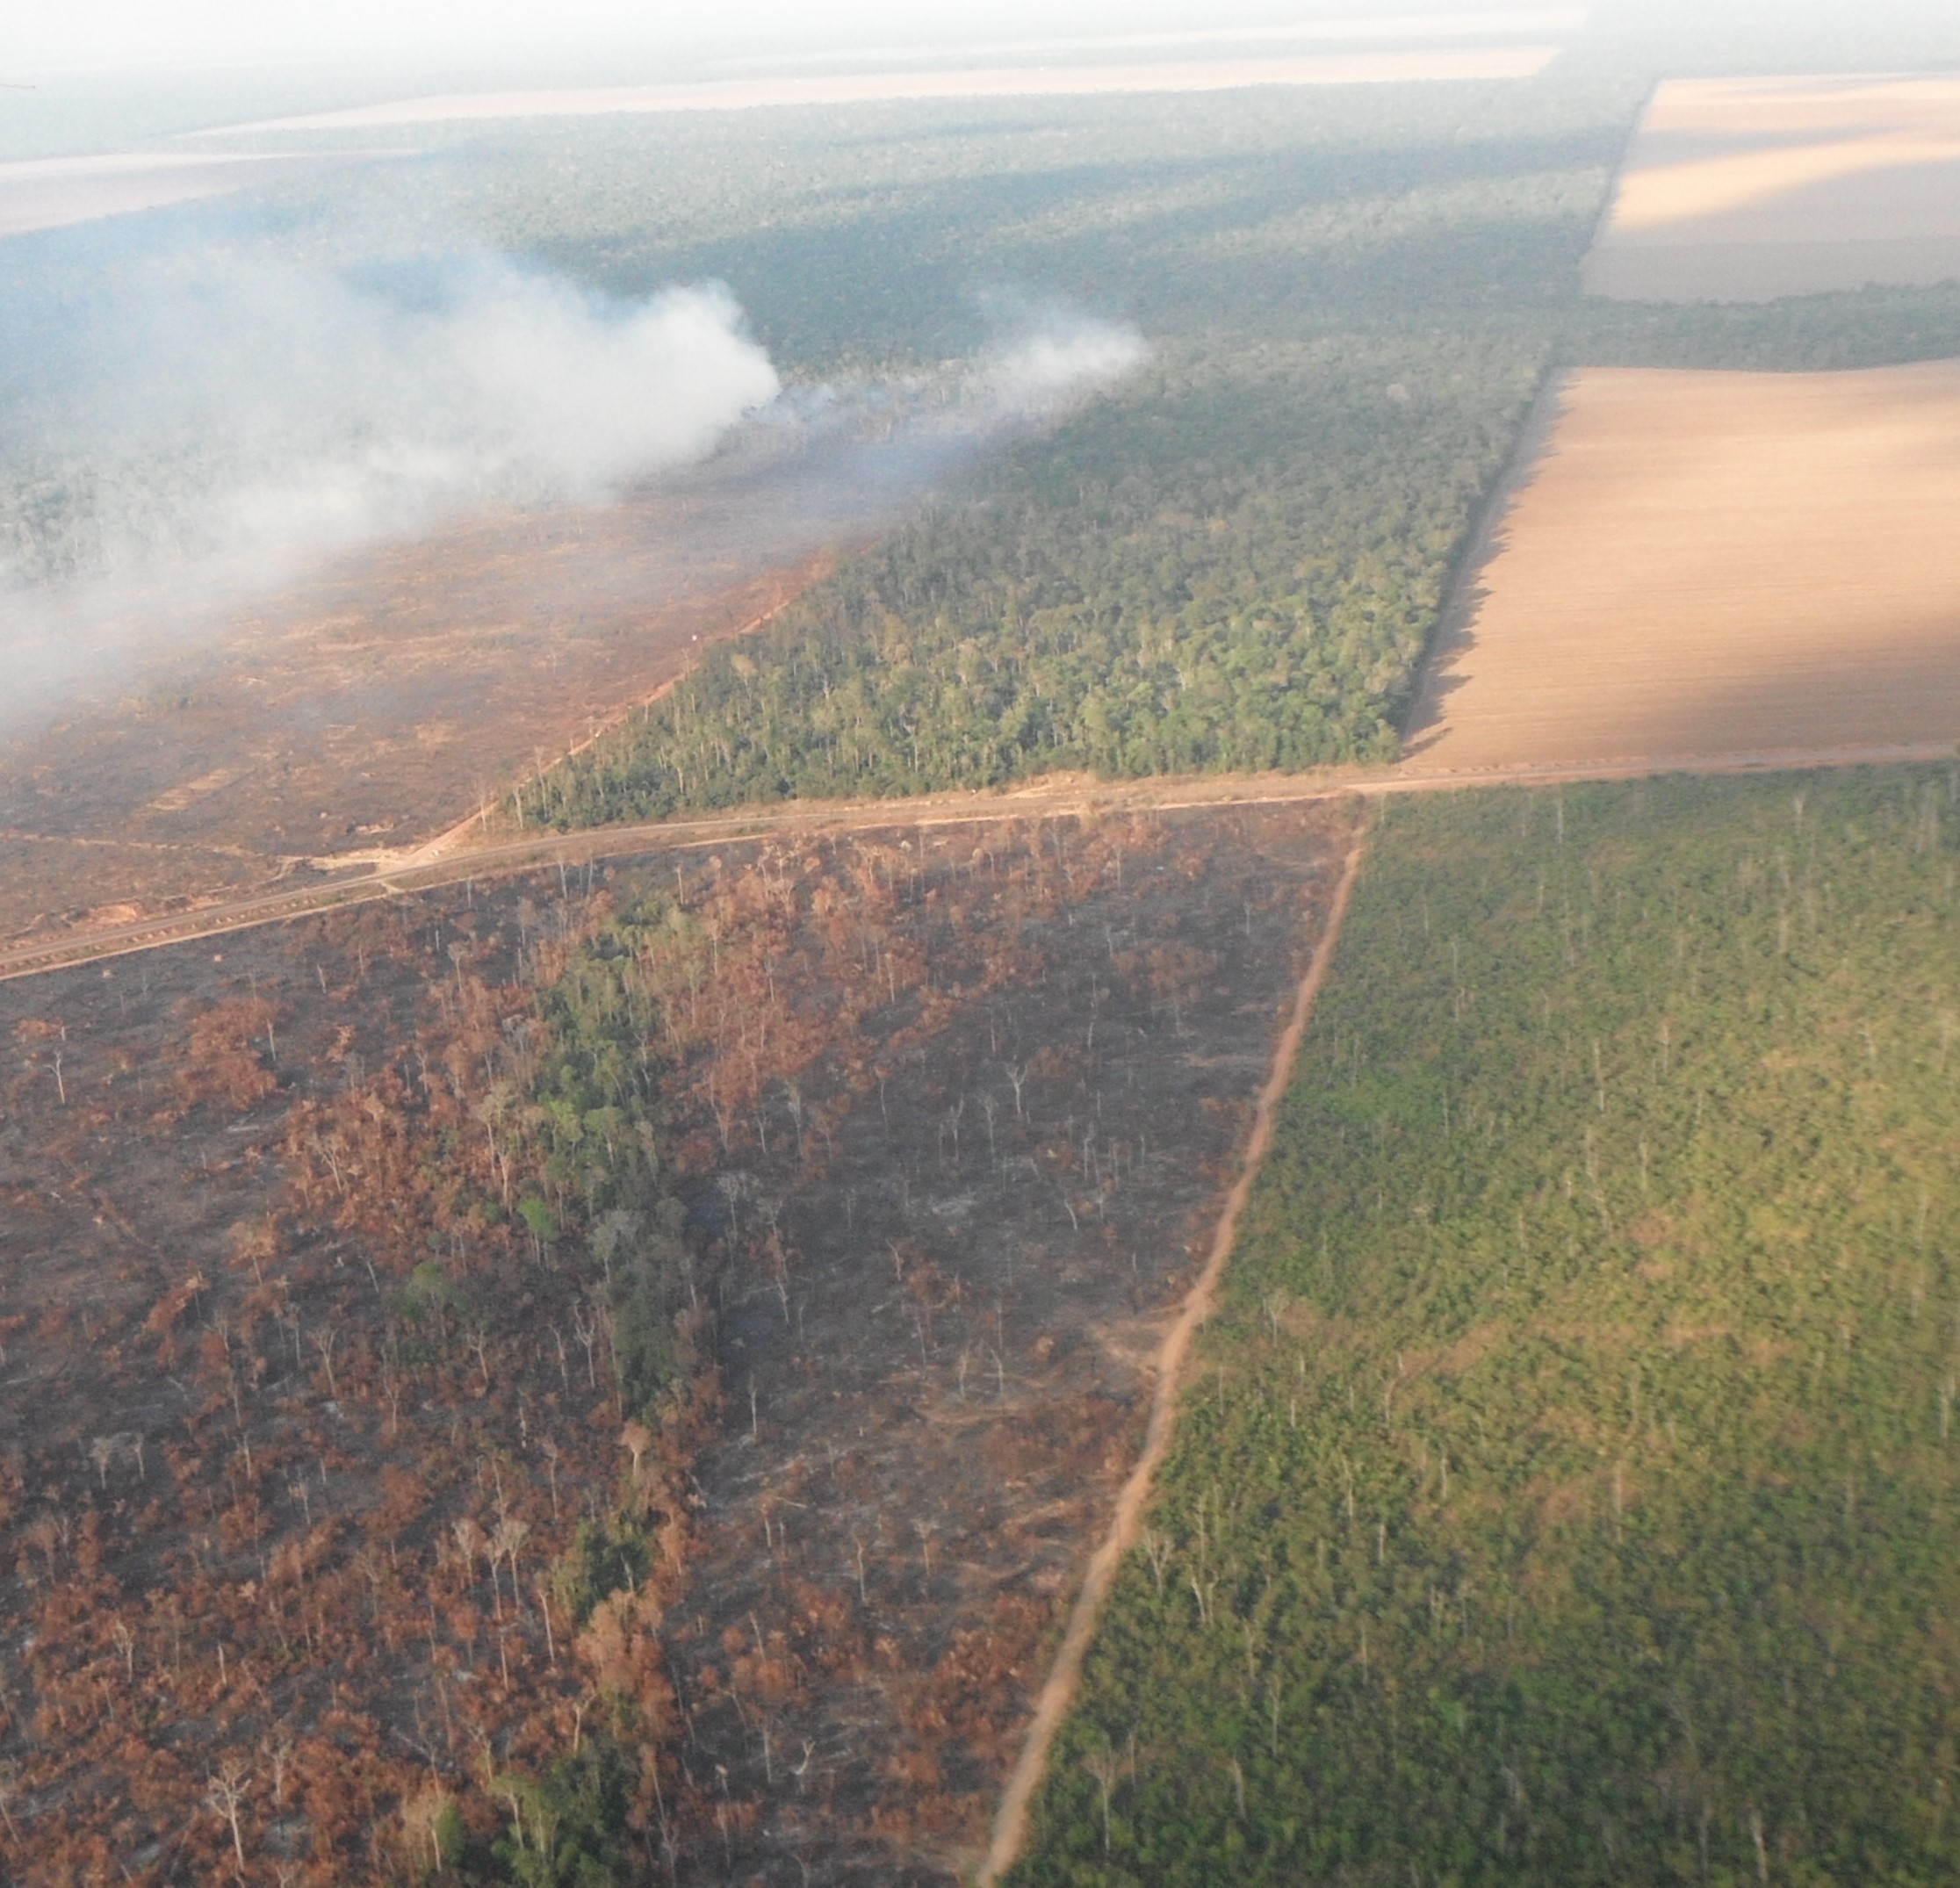
 Burned and fragmented forest in the Amazon.
“Our machine learning method was able to distinguish degraded forests from intact forests 86% of the time,” Ekena said. “Sometimes it confused logged forests with intact forests, but it is very good at identifying burned areas. And to most precisely determine the impact of forest degradation on carbon stocks, our team considered that the forest degradation classes – logged or burned – come with uncertainties, as do their corresponding carbon stock changes.”
The scientists found that building those uncertainties into the modeling led to lower estimates of mean carbon density in two of the three test sites by as much as 6.5%. That means earlier estimates that did not consider the inherent uncertainties may have been over-optimistic.
The study also suggests logged forests contain almost the same amount of carbon as intact forests, but that fire can reduce the amount of a forested area’s carbon by as much as 35%.
“Our findings indicate that, when attributing biomass changes to forest degradation, estimates need to account for the uncertainty that’s part of assigning a degradation classification,” Ekena said. “It’s important to fully understand the consequences of forest degradation on the carbon budget and the gains that might occur through regeneration.”
Read the research in full
Effects of forest degradation classification on the uncertainty of aboveground carbon estimates in the Amazon
Ekena Rangel Pinagé, Michael Keller, Christopher P. Peck, Marcos Longo, Paul Duffy & Ovidiu Csillik


