
ΑΙhub.org
Energy as a fundamental right
By Mustafa Sinan Mustafaoğlu, Gülgün Kayakutlu and M. Özgür Kayalica
Free electricity grant policies
In 2000, an innovative social policy was implemented in the Flanders Region of Belgium to alleviate energy poverty issues. All households, rich or poor, were granted free electricity to a certain extent. The total amount of electricity granted was annually 100 kWh plus 100 kWh for each person with a legal domicile in that building. For example, a household with four residents would receive 500 kWh of free electricity per year, and a household with one resident would receive 200 kWh. The financial burden of this social tariff was shared among all users connected to the grid. The system was criticized for being in favor of only the households with children, and being a burden for commercial users that could not benefit from the free electricity, and was cancelled for financial reasons in 2016.
Another free electricity grant policy, named “free lifeline electricity of 200 units”, was announced by the Delhi government of India in 2019. According to the program consumers in Delhi do not need to pay for electricity as long as they consume less than 200 kWh of electricity per month. Additionally, different discount rates are defined for the households consuming between 201 to 400 kWh of electricity.
The benefits of free electricity grant policies are expected not to be limited solely to their effect on energy poverty. Energy theft is an important problem in many countries, and the cost of stolen electricity is already being paid by the consumers connected to the grid. After implementation of such a free electricity policy, energy theft would be expected to decrease. Moreover, legal enforcements can be made stricter since the grants remove the economic reasons of energy theft for many households.
Another potential effect can be the tendency to invest in energy efficiency and renewable energy among households, especially high-income households who have the financial capability to do so. If the financial burden of free electricity grant policies is reflected in the residential electricity unit prices, households might increase their efforts to find a way to cut their excess electricity consumption. This would reduce the total demand in the electricity grid and reduce the electricity prices on the long run.
How to determine the free electricity amount?
The Flanders and Delhi examples can be considered as important milestones to tackle energy poverty. On the other hand, how can we be sure that the specified free electricity amount is served to the ones that are most in need? How can we measure the success of a free electricity policy?
In order to address this issue and determine the optimum amount of free electricity, we have developed a simulation model: EFRI (Energy as a Fundamental RIght). Among different energy poverty indicators, we have selected “the share of energy expenditure in income”, which we called “ratio in income (RII)” in short.
The data needed
In order to measure the effect of providing free electricity per resident and per household and calculate the ratio in income (RII), proper data is needed. The number of residents, household income level, and energy consumption amounts should be known, along with the electricity unit price. Fortunately, the EIA 2015 Residential Energy Consumption Survey (RECS) of the US contains the necessary inputs for our model.
The categorical income level in the RECS data is transformed into numeric averages and the ratio in incomes are calculated for each survey respondent. We have used only the electricity expenditures for the calculations and considered the households with more than 10% ratio in income (RII) as energy poor.
The EFRI simulation model
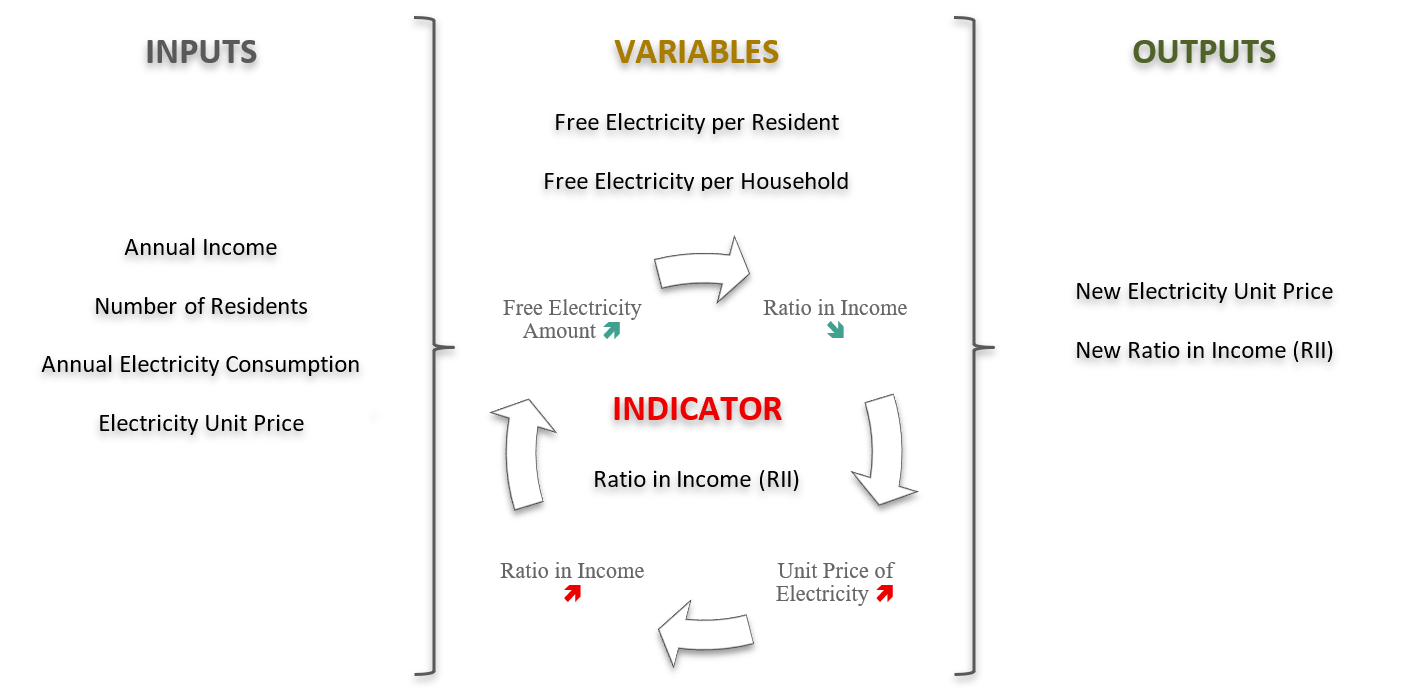
The Flanders example showed us that it is very important to determine who will pay for the free electricity. Therefore, in our simulation model we have simulated the case where all households receive free electricity and the financial burden of the free electricity is shared among only residential users. Therefore, as the free electricity amount increases, the residential electricity unit price increases as well. The flow of the simulation can be better understood from the figure below.
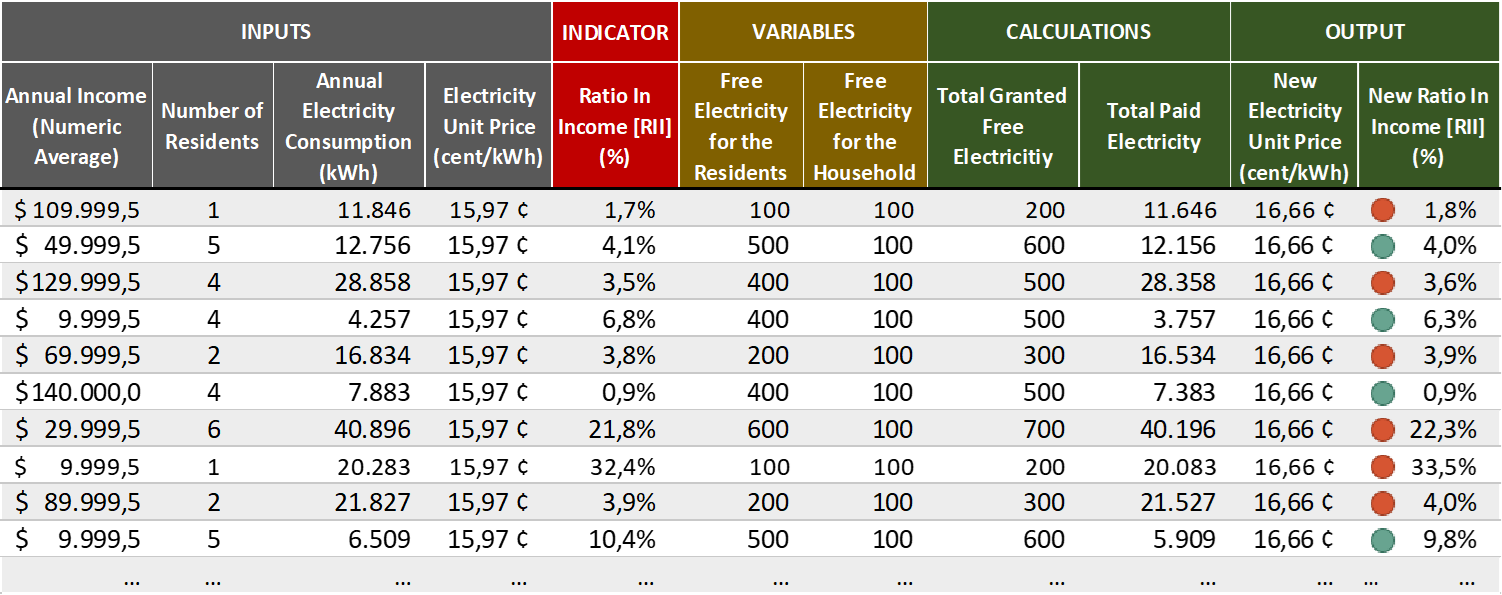
The effect of changing free electricity amount can be better understood with an example. The table below contains the effect of the Flanders policy, 100 kWh per resident and 100 kWh per household free electricity, on the Middle Atlantic region of the US on a few households.
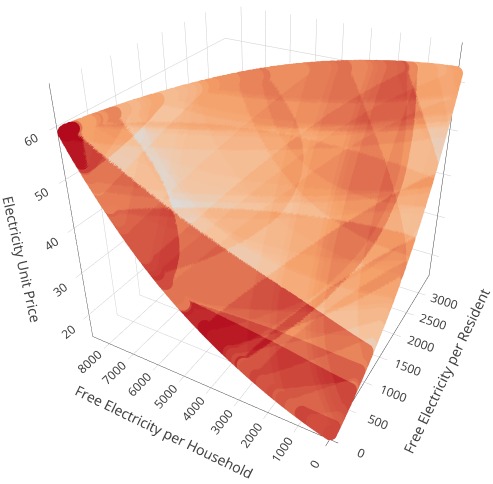
As can be understood, these results were only for the combination of 100 kWh per resident and 100 kWh per household free electricity. On the other hand, there are millions of combinations of free electricity per household and per resident. The variety of income levels, electricity consumption, and number of residents require a simulation model to calculate the optimum free electricity pair. Then the optimum amount can be determined based on the outcomes of this simulation. The following figure shows the number of residents suffering from energy poverty by the change in free electricity amounts along with its effect on the electricity unit price.
The optimum free electricity amounts
The optimum amounts can be determined by using the “Ratio in Income (RII)” in different ways. For instance, we can set our goal to minimize the number of energy poor households (NPH), or instead we can consider the number of residents and minimize the number of energy poor residents (NPR). We might wish to minimize the average ratio in income in the whole population (RIIAVE), or we might minimize the ratio in income only for the low-income households (RIIAVELOW). Similarly, we can use the median values of RII as an indicator and minimize the median ratio in income (RIIMED) or the median ratio in income for low-income households (RIIMEDLOW).
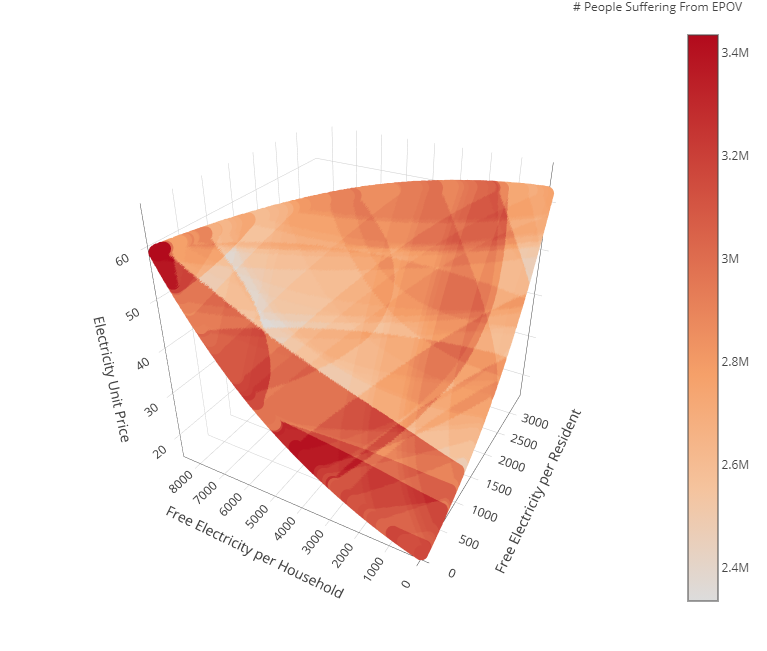
Although, different RII indicators can be used based on the aim of a free electricity policy, we have regarded the number of residents suffering from energy poverty as the most important indicator and selected NPR as our primary indicator. The following figures present the EFRI simulation results for the Middle Atlantic region of the US. The change of electricity unit price and the selected ratio in income indicators (RIIAVELOW and RIIMEDLOW) are shown in the first two figures, colored by the number of energy poor residents (NPR). The third figure, on the other hand, reveals the effect of free electricity per household and per resident on the number of energy poor residents.
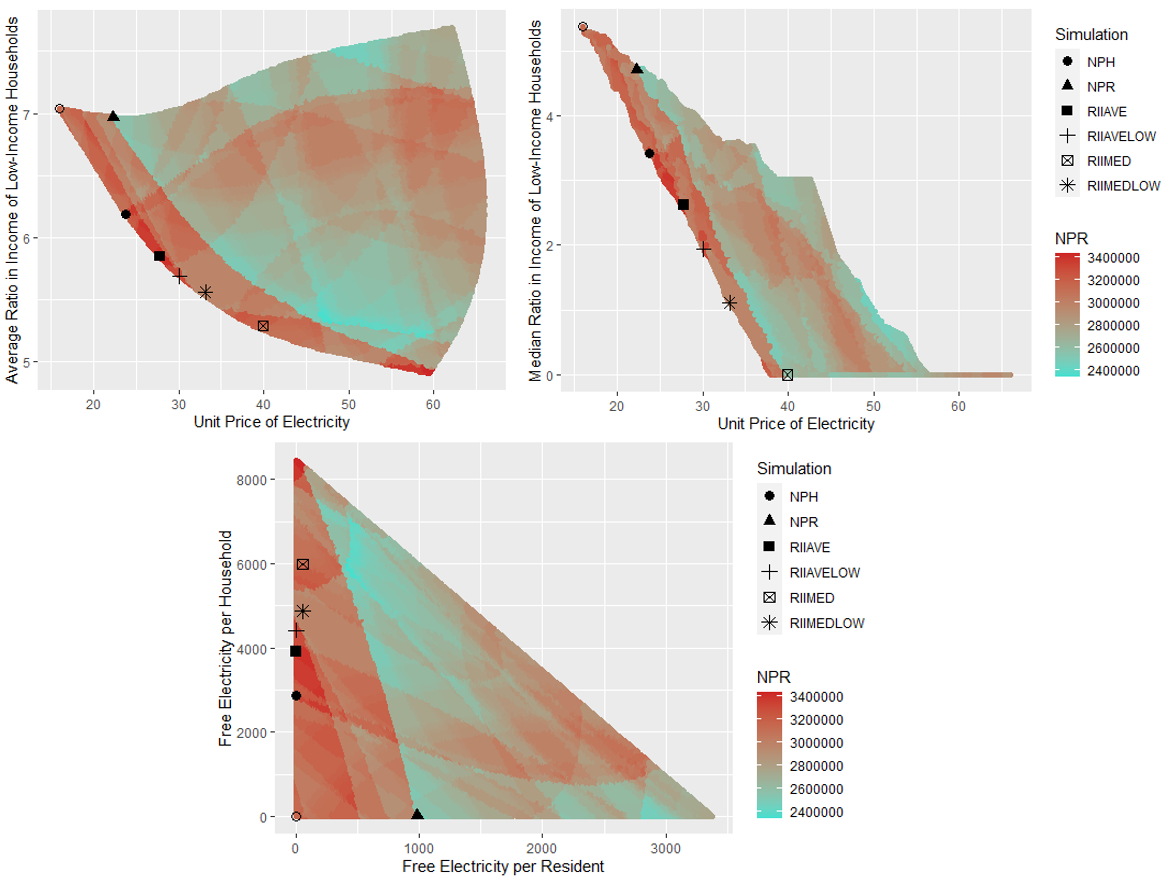
The black points on the plots represent the optimum points for each RII indicator. Although the minimum RII values can be selected as the optimum points, we aimed to find a balance between the RII indicators and rising electricity unit price. The optimum values are selected as the points with the lowest Euclidean distance to the origin of electricity unit price and selected RII indicator. The optimum combinations for each RII indicator are presented in the table below, where EPR stands for free electricity per resident, EPH for free electricity per household, and PSIM for simulated electricity unit price.
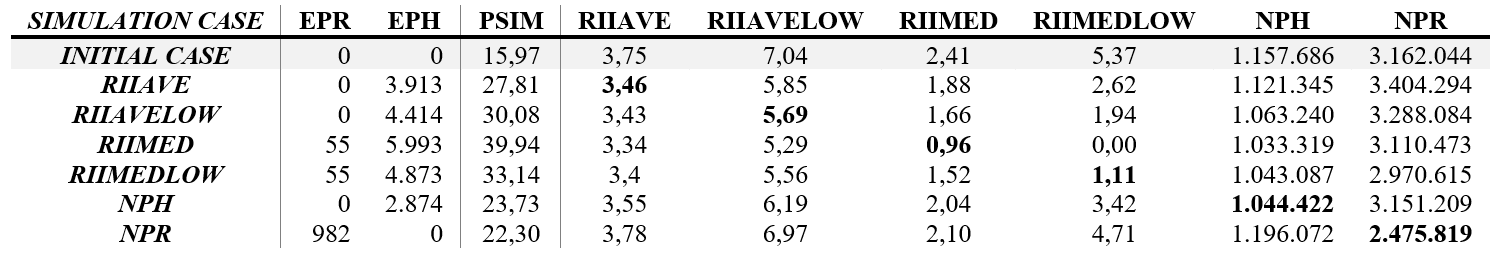
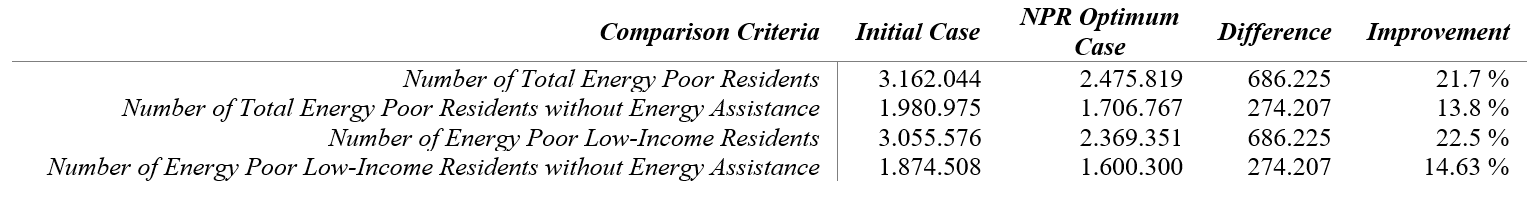
We have found that more than 680,000 people in the Middle Atlantic region alone can be saved from energy poverty by providing 982 kWh free electricity per resident per year. A free electricity grant policy with optimum free electricity amounts can improve the life of thousands in terms of health, security, and education. The potential benefit of such a policy is presented in the table below for the Middle Atlantic region of the US.
For a future without poverty
It can be seen that if the required data can be provided, simulation models such as EFRI model can be used for finding the optimum amounts and help a policy to reach its maximum potential. The ratio in income can be used as an important indicator to reveal poverty issues with other energy sources or other fundamental needs.
In the quest of resolving energy poverty and poverty in general, such simulation models can provide important insights for the researchers and policy makers to take the most appropriate action. If you would like to help develop or implement the EFRI Simulation Model for your study, feel free to use the codes located at this repository.
tags: Focus on affordable and clean energy, Focus on UN SDGs


AUAI is supported by: